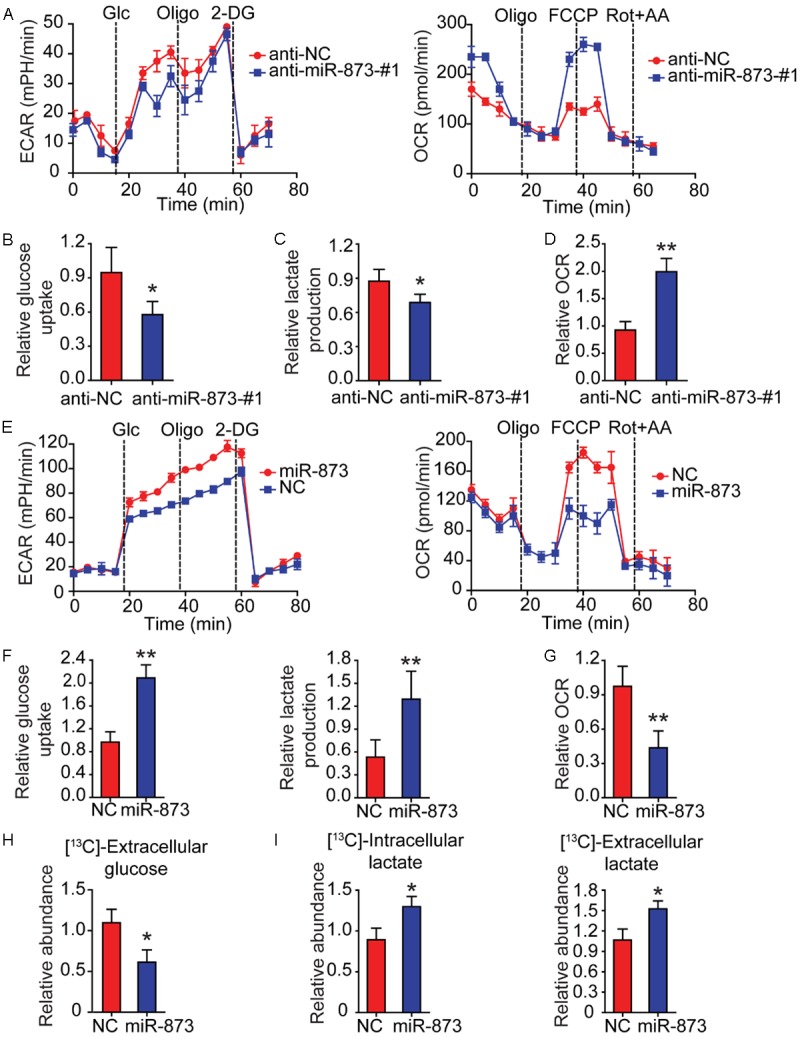
Figure 3.

MiR-873 enhances glycolysis in HCC cells. (A) By using a Seahorse Bioscience XFp analyzer, ECAR and OCR of Hep3B cells stably expressing anti-miR-873-#1 or anti-NC were measured. (B) Using the glucose assay kit, cellular glucose uptake was measured in Hep3B cells stably expressing anti-miR-873-#1 or anti-NC. The data were normalized to protein concentrations. (C) By using lactate assay kit, extracellular lactate production was measured in Hep3B cells stably expressing anti-miR-873-#1 or anti-NC. The above data were normalized to protein concentrations. (D) Equal numbers of Hep3B cells stably expressing anti-miR-873-#1 or anti-NC were subjected to an Oxytherm unit to measure the O2 consumption rate. (E) ECAR and OCR of SMMC-7721 cells with stable overexpression of miR-873 were detected using a Seahorse Bioscience XFp analyzer. (F) Cellular glucose uptake and extracellular lactate production were measured in SMMC-7721 cells with stable overexpression of miR-873 or NC using the glucose or lactate assay kit. The results were normalized to protein concentration. (G) Equal numbers of SMMC-7721 cells with stable overexpression of miR-873 or NC were subjected to an Oxytherm unit to measure their OCRs. (H, I) SMMC-7721 cells with stable overexpression of miR-873 or NC were cultured in medium containing 13C-labeled glucose for the indicated time. Extracellular 13C-labeled glucose (H), intracellular and extracellular 13C-lactate (I) were measured by GC-MS. *P < 0.05 and **P < 0.01.
