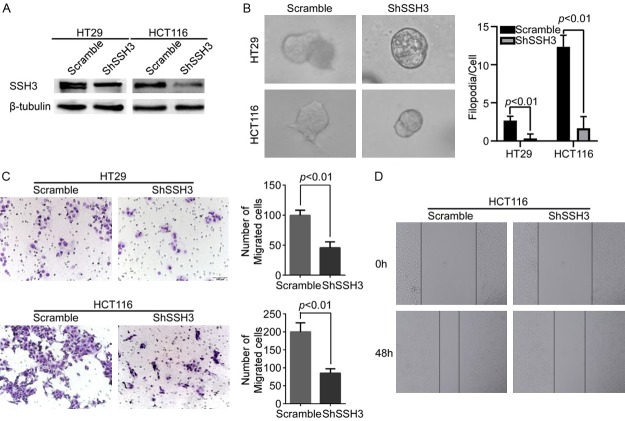
Figure 3.
Down-regulation of SSH3 inhibited the invasion and metastasis of CRC cell in vitro. A. Silencing of SSH3 in shRNA-transduced stable HT29 and HCT116 cells. β-tubulin was used as a loading control. B. Reduction of endogenous SSH3 lead to a marked decrease in the number of protrusions in three-dimensional morphogenesis assays. The bar chart represents the filopodia/cell. Error bars represent the means ± SD calculated from three parallel experiments. C. Down-regulation of SSH3 decreased cell migration as determined by transwell assays. The bar chart represents the migration cell numbers. Error bars represent the means ± SD of 5 different fields. D. Wound healing assay used to determine the migration ability of cells with down-regulated SSH3.

