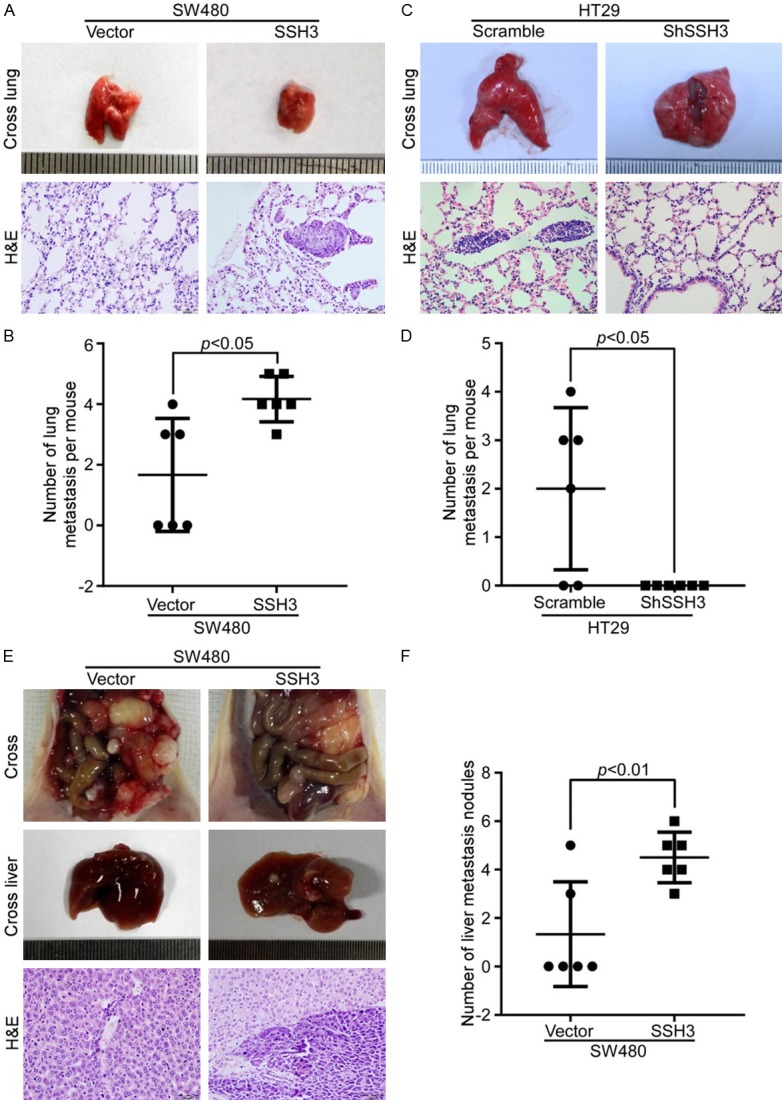
Figure 4.

SSH3 promotes the metastatic potential of CRC cells in vivo. A and C. The representative gross images of the lungs from different experimental groups are shown. Sections of the liver were stained with H&E. B and D. Box-scatter plots show the number of metastatic nodules in the lungs as observed in each group. E. The representative gross images of the intestines and livers from different experimental groups are shown. Sections of the liver were stained with H&E. F. Box-scatter plot shows the number of metastatic nodules in the liver as observed in each group.
