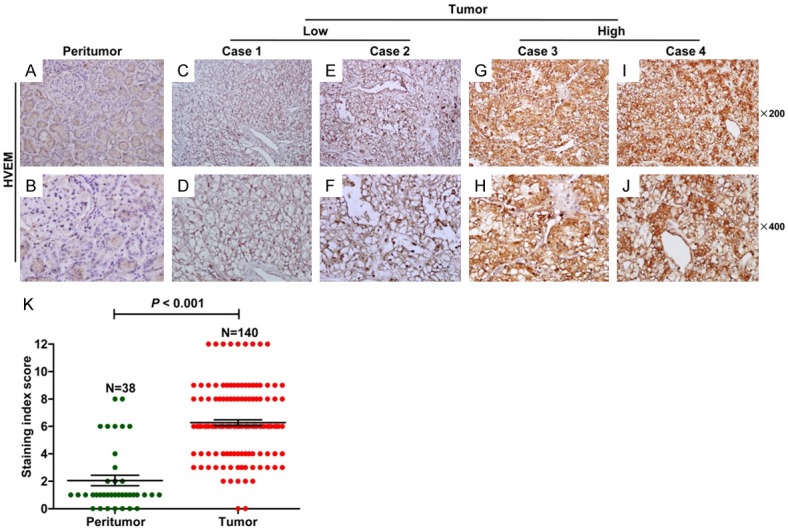
Figure 2.

Immunohistochemical assays of HVEM expression in ccRCC tissues. A, B. Expression of HVEM in peritumor tissue. (upper, original magnification × 200; lower, original magnification × 400). C-F. Low HVEM expression in tumor tissues. (upper, original magnification × 200; lower, original magnification × 400). G-J. High HVEM expression in tumor tissues. (upper, original magnification × 200; lower, original magnification × 400). K. Staining index scores of HVEM expression in tumor tissues and peritumor tissues. P < 0.05 by the Mann Whitney test was considered statistically significant.
