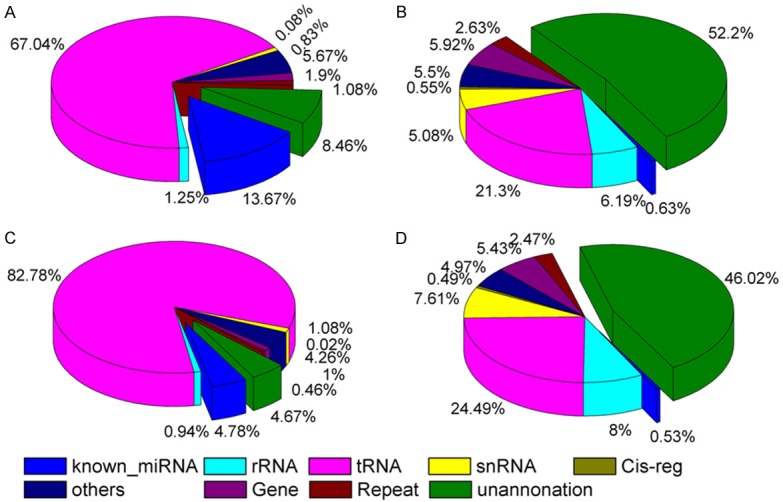
Figure 1.

Distribution of sRANs among different categories in the Ctrl and OP library. 4.89 M and 1.73 M reads in the control (13.67%) and OP (4.79%) libraries, respectively, were classified as know miRNAs, while 3.02 M and 1.66 M reads in the control (8.47%) and OP (4.68%) libraries, respectively, were unannotated and required further analysis for novel miRNA candidates. A: Total number of reads in Ctrl. B: Total number of unique sequences in Ctrl. C: Total number of reads in OP. D: Total number of unique sequences in OP.
