
Figure 2.
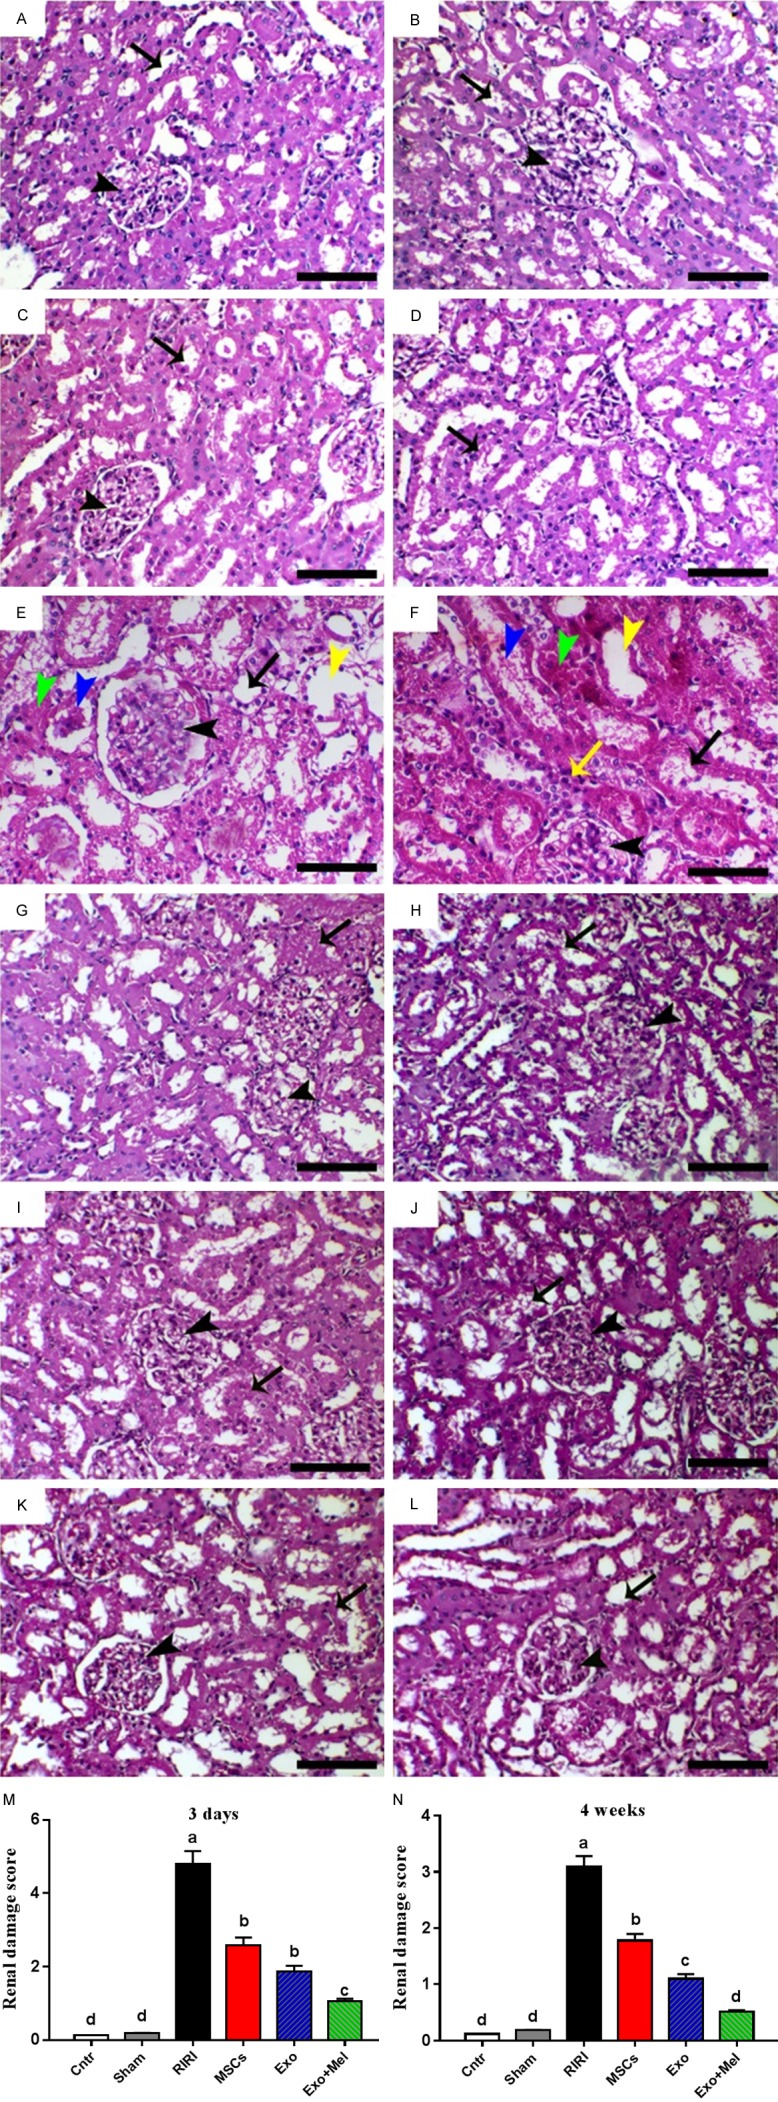
H&E staining and the analysis of renal damage score. (A, B) Control group; (C, D) Sham group; (E, F) RIRI group; (G, H) MSCs group; (I, J) Exo group; and (K, L) Mel + Exo group at 3 days (A, C, E, G, I, K) and 4 weeks (B, D, F, H, J, L) post-ischemia. In all images, black arrows and arrowheads refer to renal tubules and glomeruli, respectively. (M and N) Pathological scoring of kidney at 3 days (M) and 2 weeks (N). Values were means ± SEM (n = 10/group and 5/each time point). *P < 0.05, **P < 0.01, ***P < 0.001. Scale bars = 50 µm in (E and F); 100 µm in all remaining images.