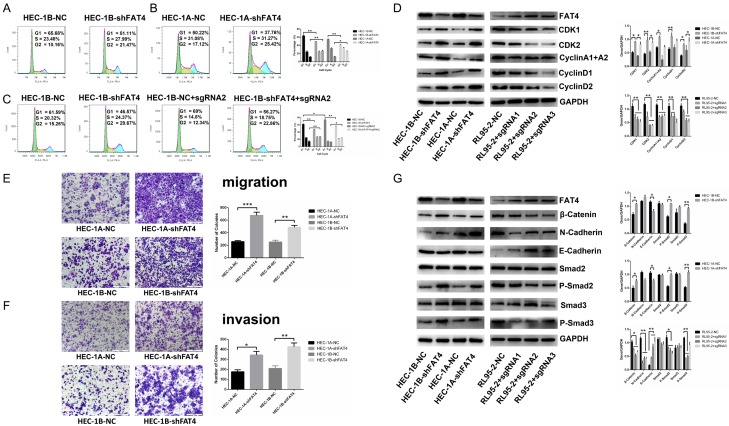
Figure 4.
FAT4 inhibited EC cell cycle progression, cell invasion and altered cell cycle-associated protein markers and invasion-associated protein markers in the HEC-1A, HEC-1B and RL95-2 cell lines. A, B: Flow cytometry assay showed a decrease in the percentage of cells in G1 phase and a concomitant increase in that in G2 phase, while the percentage in S phase remained stable in FAT4-silenced HEC-1A and HEC-1B cells. The data are presented as mean ± SD, t-test, *P<0.05, **P<0.01. C: Flow cytometry assay revealed that upregulating FAT4 in HEC-1B-NC cells increased the G1 phase population and that upregulating FAT4 in HEC-1B-shFAT4 cells rescued the increase in proliferation upon FAT4 silencing. The data are presented mean ± SD, t-test, *P<0.05, **P<0.01. D: Western blotting showed that CDK1, CDK2, cyclin A1+A2, cyclin D1 and cyclin D2 expression was increased in HEC-1A-shFAT4 and HEC-1B-shFAT4 cells compared with HEC-1A-NC and HEC-1B-NC cells. The expression of these markers was decreased in RL95-2-sgRNA cells with upregulated FAT4 expression compared with RL95-2 negative control cells, The data are presented as the mean ± SD, t test. *P<0.05, **P<0.01. E, F: Knockdown of FAT4 in both the HEC-1A and HEC-1B cell lines significantly promoted EC cell migration and invasion, as shown by adhesion and transwell cell migration and invasion assays. The data are reported as the average cell count in five random areas in each transwell membrane. Each sample was tested in triplicate. **P<0.01, ***P<0.001, t test. G: FAT4 modulated the expression of migration-associated markers. HEC-1A and HEC-1B cells were infected with NC or shFAT4, and the expression of β-catenin, N-cadherin, P-Smad2 and P-Smad3 was significantly decreased, E-cadherin expression increased, and Smad2 and Smad3 showed stable expression. RL95-2 cells were infected with NC or sgRNA1-3, and the expression of β-catenin, N-cadherin, P-Smad2 and P-Smad3 was significantly upregulated, E-cadherin was downregulated, and Smad2 and Smad3 were stably expressed. GAPDH served as a loading control. The data are presented as the mean ± SD, t test. *P<0.05, **P<0.01.

