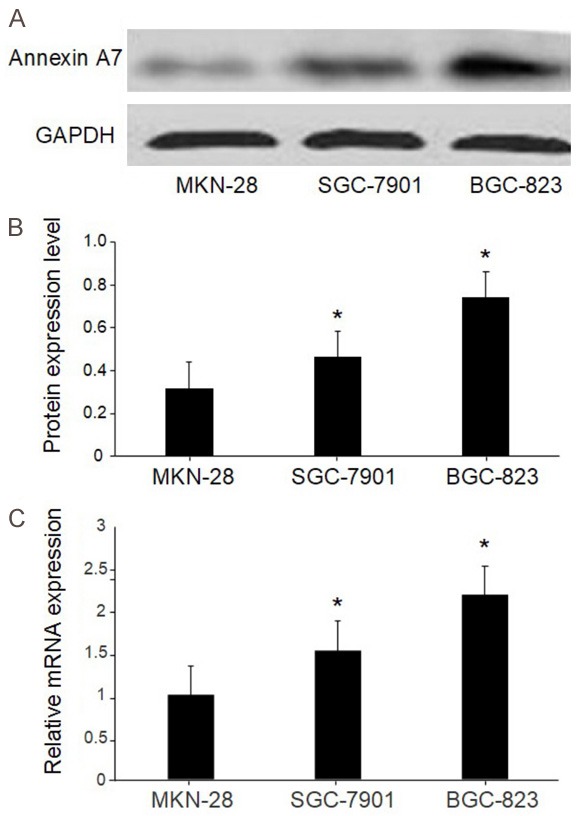
Figure 2.

The expression of annexin A7 measured by Western blot. A. The expression of annexin A7 in different differentiation level gastric cancer cell lines. The expression of annexin A7 measured by Western blot. B. Ratio of pixel densities in different differentiated gastric cancer cell lines. C. The expression levels of Annexin A7 mRNA in different differentiated gastric cancer cell lines. *, P < 0.05, compared with MKN-28.
