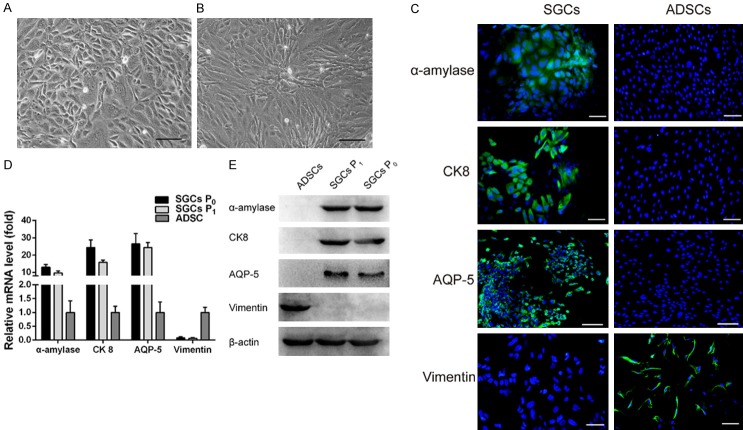
Figure 2.
Characterization of SGCs. ADSCs were the control cells. A and B. Morphology of primary SGCs (SGCs P0) and passage 1 SGCs (SGCs P1), respectively. C. IF staining of α-amylase, CK8, and AQP-5 was positive for SGCs and negative for ADSCs. IF staining of vimentin was negative for SGCs, but positive for ADSCs. D. Expression levels of α-amylase, CK8, and AQP-5 mRNA in SGCs. E. Western blotting confirmed the expression of α-amylase, CK8, and AQP-5 in SGCs. Scale bar = 100 μm.

