
Figure 1.
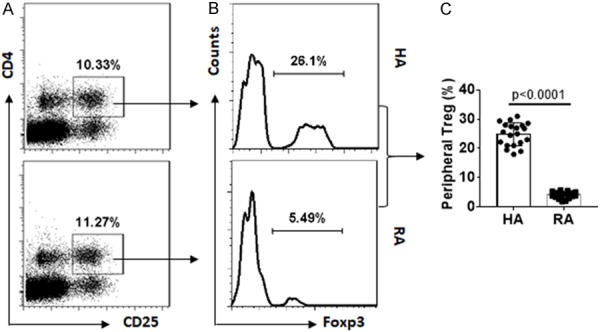
Peripheral Treg frequency is lower in RA patients. Blood samples were collected from RA patients (n=20) and HA subjects (n=20). PBMCs were isolated from the samples and analyzed by flow cytometry. (A) Gated dot plots indicate frequency of CD4+ CD25+ T cells. (B) Gated dot plots indicate frequency of Foxp3+ Tregs in the gated CD4+ CD25+ T cells of (A). (C) Summarized Treg frequency of (B).