Figure 1.
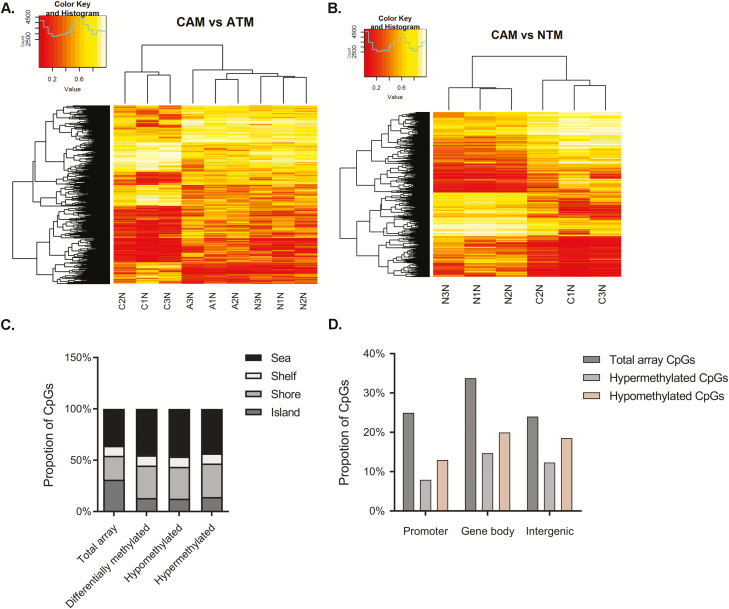
DNA methylation profiling of primary myofibroblasts purified from different tissue microenvironments. (A) Unsupervised clustering of 5688 CpG loci with marked differential methylation in CAMs and patient-matched ATMs with projection including related values observed in NTMs. (B) Unsupervised clustering of 8104 CpG loci with marked differential methylation in CAMs and unrelated NTMs. Heatmaps represent differentially methylated CpG loci identified in respective comparisons |Δβ| > 0.2, P value < 0.05. (C and D) Distribution of differentially methylated CpG loci identified in CAMs versus ATMs (C) in CpG islands, shores, shelves and sea regions or (D) relative to RefSeq gene promoters, gene bodies and intergenic regions.

