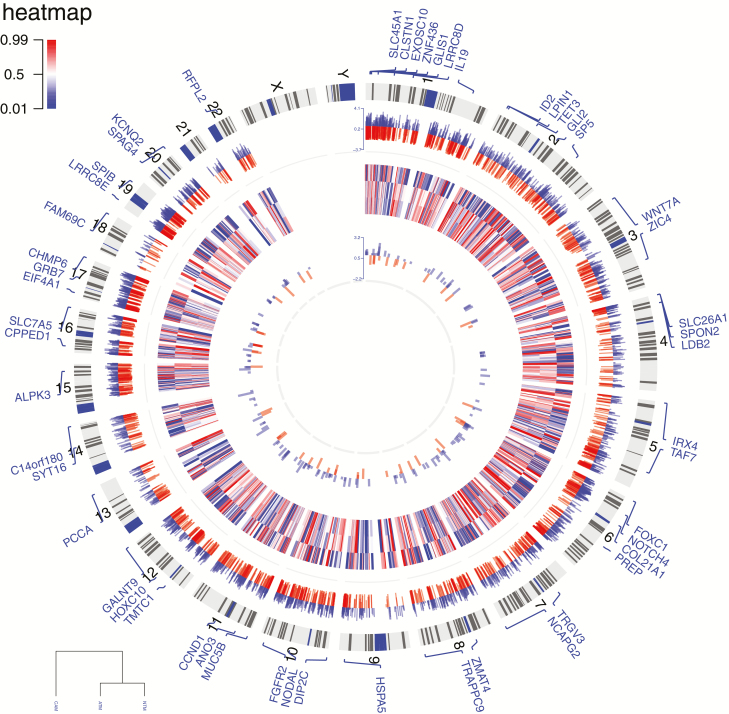
Figure 2.
Circular plot of genome-wide DNA methylation changes in stromal myofibroblasts. The outer ring represents human ideograms. The first track shows differentially methylated CpG sites between gastric CAMs and patient-matched ATMs. The heatmap represents CpG loci that distinguish CAMs from non-tumour derived myofibroblasts (ATMs and NTMs). These loci may serve as proxies for the identification of gastric CAMs. The innermost track represents conserved CAM susceptible loci identified in both gastric and oesophageal CAMs compared to patient-matched ATMs; red—hypermethylated loci in CAMs, blue—hypomethylated loci in CAMs; |Δβ| > 0.2, P value < 0.05.

