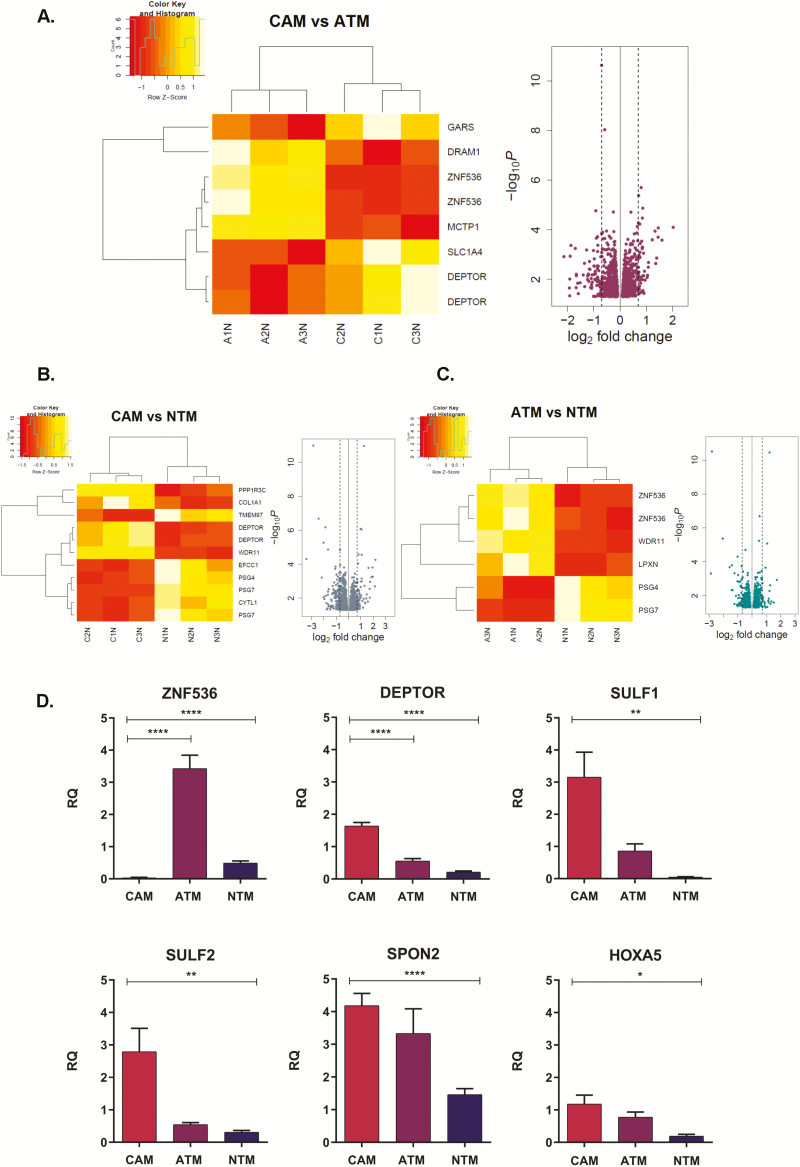
Figure 3.
Differential gene expression signatures in gastric myofibroblasts purified from different tissue microenvironments. (A) CAM versus ATM. (B). CAM versus NTM. (C) ATM versus NTM. Heatmaps represent differentially expressed genes in respective comparisons FDR P value < 0.05; volcano plots represent differentially expressed genes P value < 0.05; dashed lines 1.6-fold change. (D) Quantitative PCR validations of genes identified as differentially expressed in CAM versus ATM and CAM versus NTM comparisons. Each TaqMan assay was performed in triplicates for CAM (n = 3), ATM (n = 3) and NTM (n = 3) samples. The comparative ΔΔCt method was used and samples were normalized to calibrator. Error bars represent standard error of mean; CAM versus ATM t test ****P < 0.0001; CAM versus NTM t test ****P<0.0001, **P<0.01, *P < 0.05.

