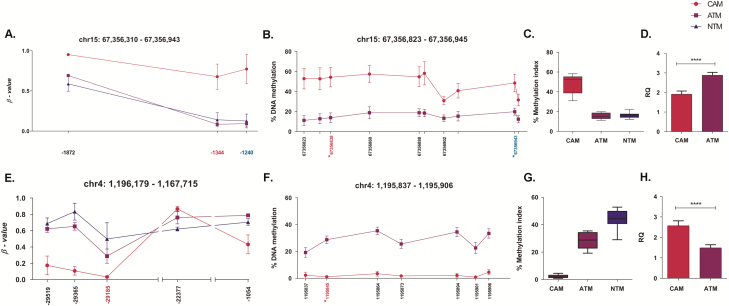
Figure 4.
Changes in DNA methylation in the SMAD3 and SPON2 promoter regions regulates gene expression in gastric CAMs and ATMs. (A) Differentially methylated CpG loci identified by Illumina 450k array in the SMAD3 promoter region. Mean β values (n = 3) for probes identified as differentially methylated in CAM versus ATM and CAM versus NTM comparisons. The x-axis indicates the distance of Illumina 450k probes from SMAD3 transcription start site. Positions highlighted in magenta (–1344) and blue (–1240) are within the genomic region examined by corresponding pyrosequencing assays. (B) Pyrosequencing analysis of the SMAD3 promoter region was performed on patient-matched CAM (n = 7) and ATM (n = 7) samples. Methylation means for 10 individual CpG sites in the SMAD3 promoter region are plotted. The x-axis indicates the chromosomal position of examined CpG sites. Positions marked with * correspond to the Illumina 450k probes. (C) The overall methylation level of the SMAD3 promoter region interrogated by pyrosequencing analysis. Boxplots represent methylation distribution and mean for 10 CpG sites in CAM (n = 7), ATM (n = 7) and NTM (n = 4) samples. (D) Quantitative PCR analysis of SMAD3 gene expression in CAM (n = 6) and ATM (n = 6) samples; t test ****P < 0.0001. Error bars represent SEM. DNA methylation in the SPON2 promoter region correlates with SPON2 gene expression in gastric CAMs and ATMs. (E) Differentially methylated CpG sites identified by Illumina 450k array in the SPON2 promoter region. Mean β values (n = 3) for probes found to be differentially methylated in CAM versus ATM and CAM versus NTM comparisons. The x-axis indicates the distance of Illumina 450k probes from the SPON2 transcription start site. Position highlighted in magenta (–29185) is within the genomic region examined by pyrosequencing. (F) Pyrosequencing analysis of the SPON2 promoter region in patient-matched CAM (n = 7) and ATM (n = 7) samples. Methylation means for seven individual CpG sites in the interrogated promoter region are plotted. The x-axis indicates the chromosomal position of examined CpG sites. Position marked with * corresponds to the Illumina 450k probe highlighted in magenta (–29185) in Panel E. (G) The overall methylation level of the SPON2 promoter region interrogated by pyrosequencing. Boxplots represent methylation distribution and mean for seven CpG sites in CAM (n = 7), ATM (n = 7) and NTM (n = 4) samples. (H) Quantitative PCR analysis of SPON2 gene expression in CAM (n = 6) and ATM (n = 6) samples; t test ****P < 0.0001. Error bars represent standard error of mean.

