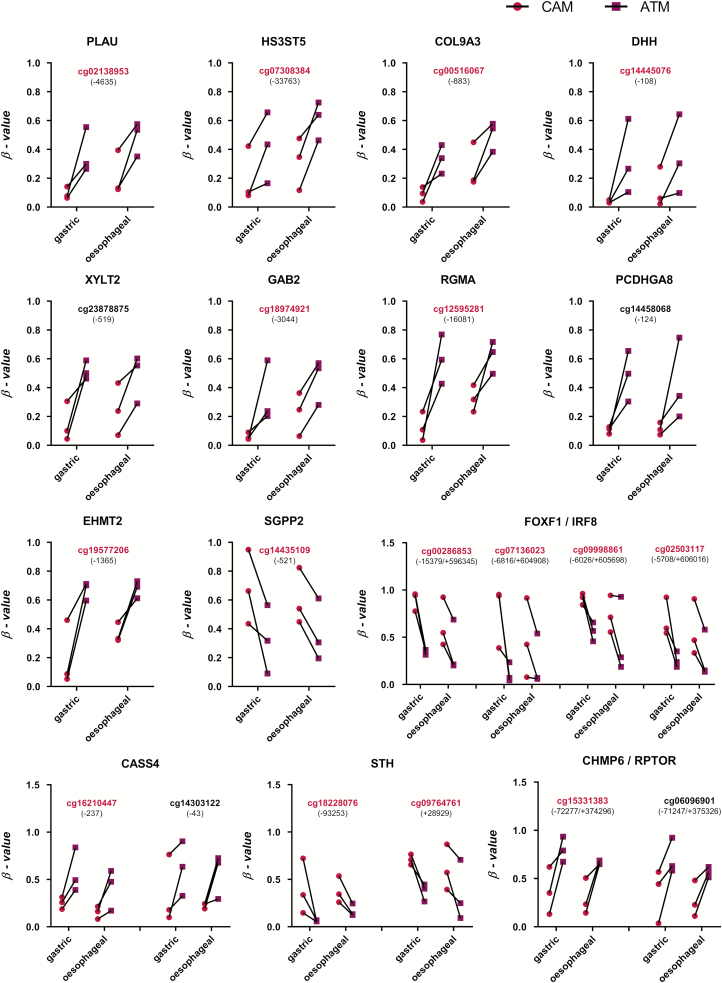
Figure 6.
Representative conserved DNA methylation patterns in gastric and oesophageal patient-matched CAM and ATM samples. Probes highlighted in magenta are also identified as proxies for gastric CAMs. Numbers in brackets indicate the distance to transcription start site (TSS) of a given gene (indicated at the top of each plot); magenta—CAMs, purple—ATMs; |Δβ| > 0.2, P value < 0.05.

