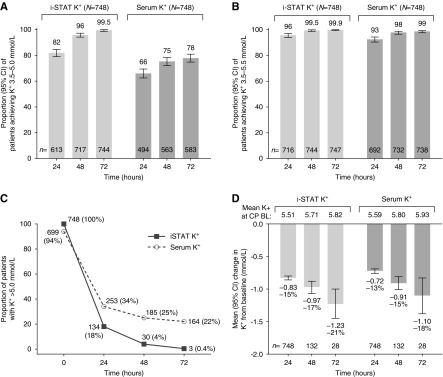
Figure 2.
Proportion of participants who achieved a potassium (K+) value of (A) 3.5–5.0, (B) 3.5–5.5, or (C) >5.0 mmol/L by i-STAT and serum K+ during the correction phase (CP) and (D) change in K+ from baseline (with annotated mean change and percentage change values) by i-STAT and serum K+ during the CP. Data in A and B were calculated using the last observation carried forward method. BL, baseline; 95% CI, 95% confidence interval.

