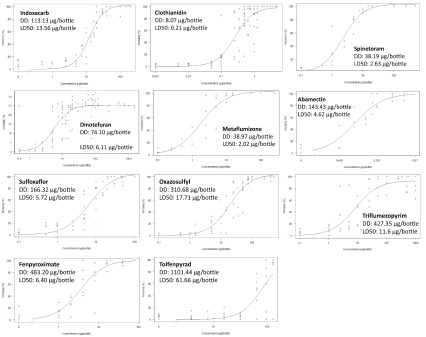
Figure 3. The 24-hour mortality dose response curves and discriminating doses of the 11 shortlisted compounds.
Dose response curves were produced by measuring mortality of adult female Anopheles gambiae mosquitoes exposed to dried deposits of compounds applied in acetone to the inside of a bottle, in a version of the CDC bottle bioassay. Discriminating dose is calculated as the LC 95 multiplied by 3.

