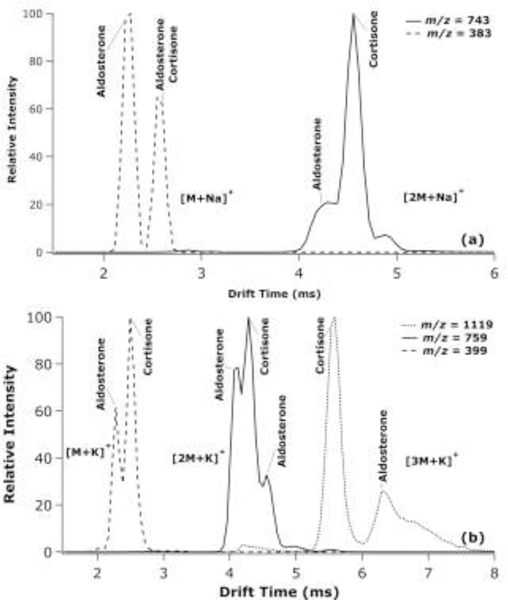
Figure 4.

Extracted TWIMS-MS ATDs at the indicated m/z values for aldosterone and cortisone sodiated monomer and dimer species (a) and as the potassiated monomer, dimer, and trimer species (b), where two species labelled at the same peak represents an overlap of the two ATDs.
