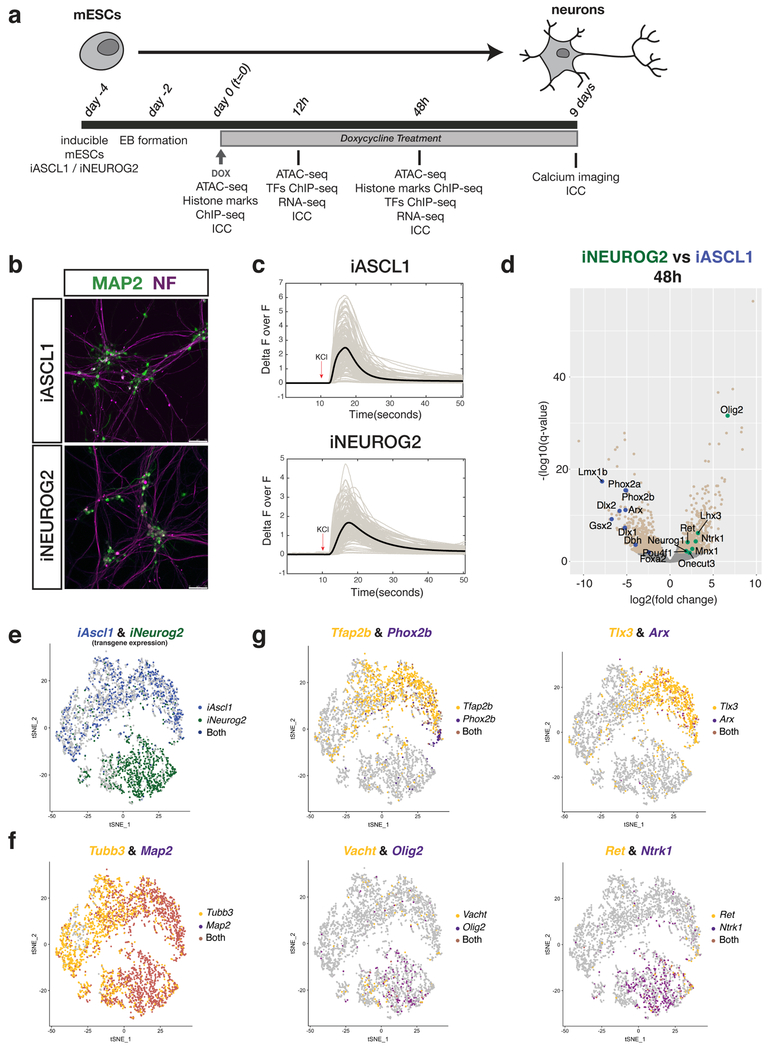
Fig. 1: Ascl1 and Neurog2 induction in differentiating mESCs generates neurons with distinct neuronal subtype bias.
a, Experimental scheme (EB: Embryoid body; ICC: Immunocytochemistry). b, iA and iN neurons express mature neuronal markers MAP2 (green) and Neurofilament (NF; purple) 9 days after Ascl1 and Neurog2 induction, respectively. Similar results were obtained n=2 independent cell differentiations. c, iA and iN neurons change their Ca++ levels upon KCl depolarization (9 days after induction). The thick line shows the average of individual recordings (from n=2 independent cell differentiations). d, Volcano plot comparing mRNA levels between iA and iN neurons by RNA-seq at 48 hours after induction (iA 48h n=5; iN 48h n=2). Beige dots represent the differentially expressed genes between iA or iN (q-value < 0.01, Wald test). Green and blue dots represent examples of differentially expressed genes in iN and iA, respectively. e, tSNE plot showing the single-cell clustering of the iA or iN neurons. Dots are colored by the expression of transgenes (iA cells – blue (top cluster), iN cells – green (bottom cluster) (n=1 cell differentiation). f, tSNE plot showing the cells that express generic neuronal markers Tubb3 and Map2. Note the maturation axis towards the left of the clusters (n=1 cell differentiation). g, tSNE plots showing iA and iN clusters expressing distinct neuronal subtype markers. The dots are colored by expression of Ascl1-specific genes Tfap2b&Phox2b (noradrenergic) and Tlx3&Arx (interneuron) (top panel), or Neurog2-specific genes Vacht&Olig2 (motor neuron) and Ret&Ntrk1 (sensory neuron) (bottom panel) (n=1 cell differentiation).

