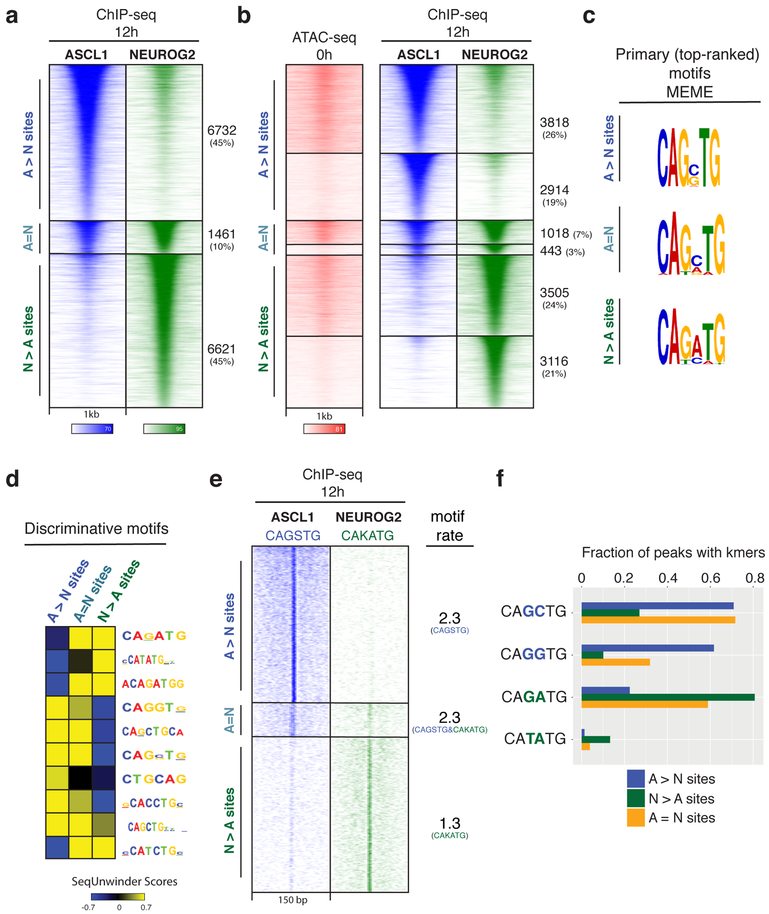
Fig. 2: Genome-wide characterization of Ascl1 and Neurog2 binding and its determinants.
a, ChIP-seq heatmap showing Ascl1 and Neurog2 binding at 12 hours after induction. Ascl1- and Neurog2-preferred sites are designated as “A>N” and “N>A”, respectively. Sites that are bound by both Ascl1 and Neurog2 are designated as shared sites (A=N). Top 10k sites are plotted on the heatmap within a 1kb window around the peak center (n=3). b, Ascl1 and Neurog2 binding does not depend on prior chromatin accessibility. Ascl1 and Neurog2 ChIP-seq heatmap partitioned into previously accessible and inaccessible sites per 0h ATAC-seq signal at bound sites. c, Primary (top-ranked) motifs enriched at the differentially bound A>N, N>A, and shared (A=N) sites differ in central nucleotides. d, The discriminative motifs enriched at the A>N, A=N, N>A sites corroborate the relative enrichment of the distinct E-box variants. e, CAGSTG and CAKATG k-mer occurrences plotted at Ascl1 and Neurog2 binding sites within a 150 bp window (S: G/C; K: G/T). The rate of motif/k-mer occurrence at the binding sites are shown on the right. f, Ascl1 and Neurog2 differentially bound sites are distinguished by specific E-box instances. Fraction of differentially bound and shared sites containing various k-mer sequences within a 150 bp window around the peak center.

