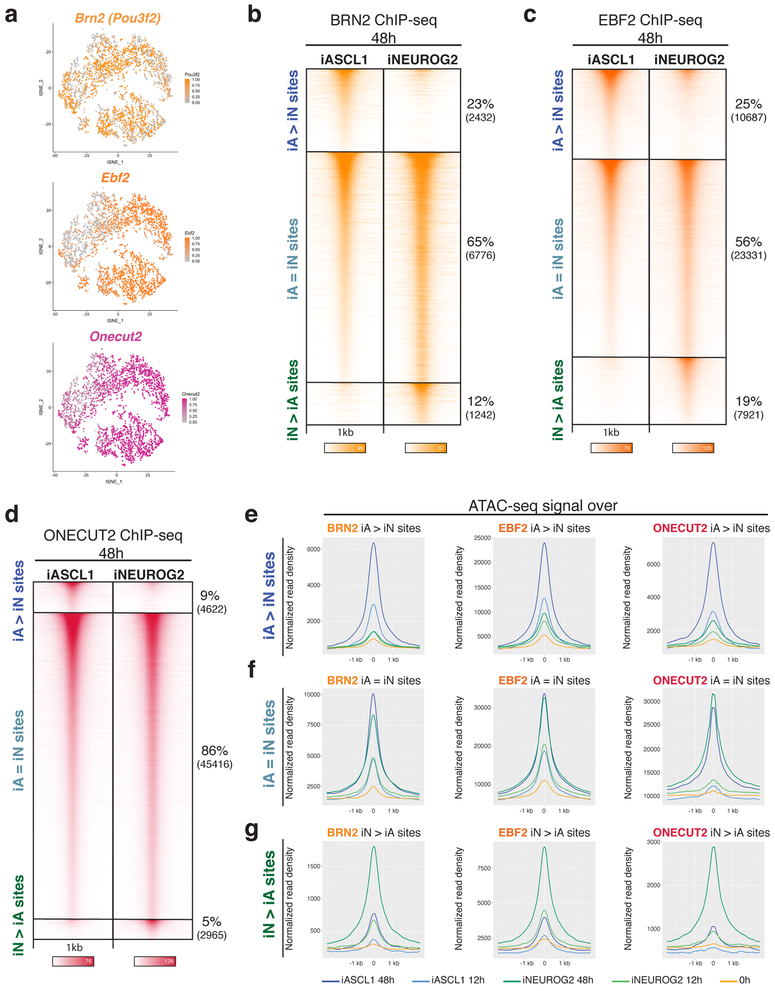
Fig. 5: Differential chromatin landscapes induced by Ascl1 and Neurog2 shape the binding patterns of the shared downstream TFs.
a, tSNE plots showing the cells that express downstream TFs (Top cluster iA, below cluster iN – Fig. 1e). The dots are colored by the expression levels of downstream TF Brn2, Ebf2, and Onecut2 (n=1 cell differentiation). b-d, ChIP-seq heatmaps of endogenous Brn2 (A), Ebf2 (B), and Onecut2 (C) binding in iA and iN neurons at 48h after induction of Ascl1 and Neurog2. “iA>iN” designates sites enriched in iA neurons, “iN>iA” designates sites enriched in iN neurons, and “iA=iN” designates shared binding in both neurons (n=2). e, Metagene plots of accessibility (ATAC-seq reads) overlap at the differentially bound sites of Brn2 (left), Ebf2 (middle), and Onecut2 (right) in iA neurons (iA>iN sites).f, Metagene plots of accessibility (ATAC-seq reads) overlap at the shared sites of Brn2 (left), Ebf2 (middle), and Onecut2 (right) in iA and iN neurons (iA=iN sites). g, Metagene plots of accessibility (ATAC-seq reads) overlap at the differentially bound sites of Brn2 (left), Ebf2 (middle), and Onecut2 (right) in iN neurons (iN>iA sites).

