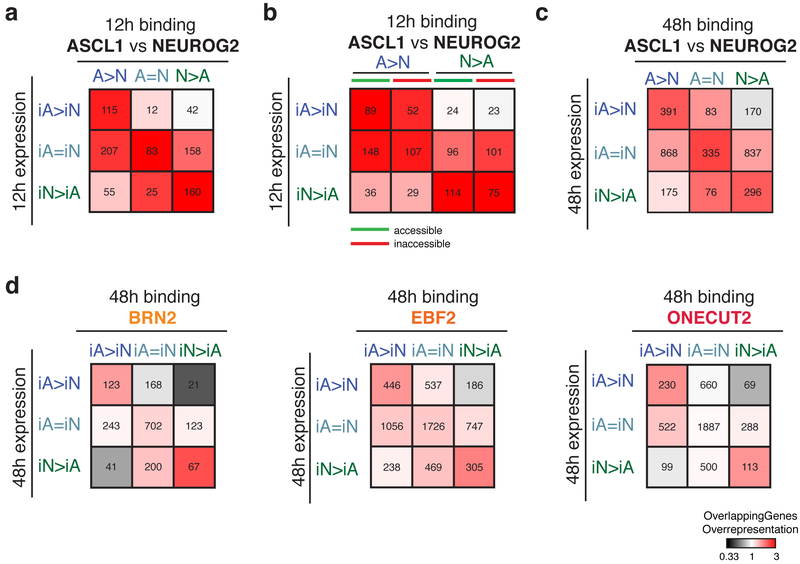
Fig. 7: Associations between genomic binding sites and gene expression.
a, Heatmap representing the associations (ratio between the genes overlapped by Ascl1 or Neurog2 peaks versus random peaks: overlapping genes overrepresentation) between 12h Ascl1 and Neurog2 binding with 12h gene expression. b, Heatmap representing the associations between 12h Ascl1 and Neurog2 sites that were previously accessible (green) or inaccessible (red) with 12h gene expression. c, Heatmap representing the associations between 48h Ascl1 and Neurog2 binding with 48h gene expression. d, Heatmap representing the associations between 48h Brn2 (top), Ebf2 (middle), Onecut2 (bottom) binding in iA and iN neurons with 48h gene expression in iA and iN neurons. For all panels: the number of genes that overlap with specific binding classes are listed inside the squares.

