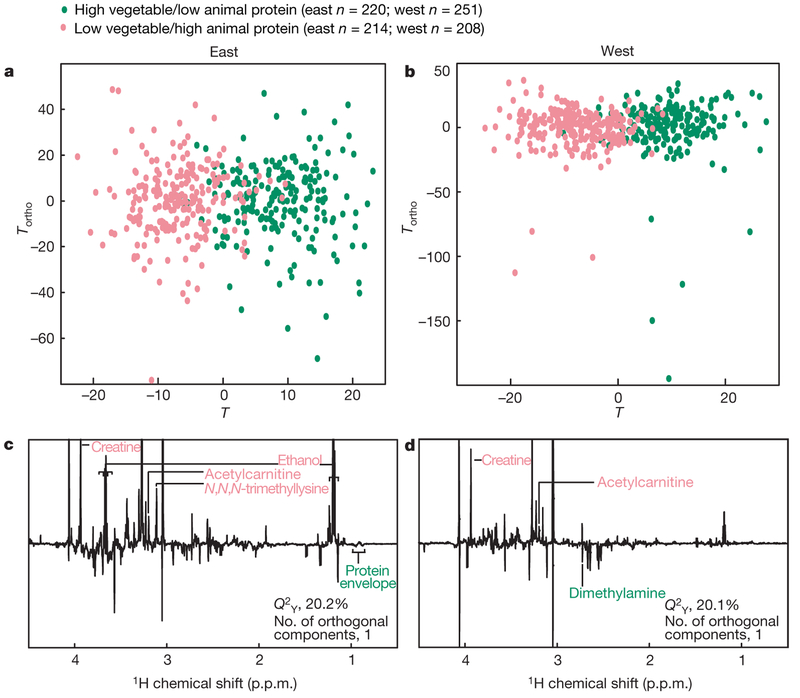
Figure 3 |. O-PLS-DA scores and loadings plots (bootstrap analyses) for participants reporting high vegetable/low animal protein and low vegetable/high animal protein intakes, first 24-h urinary specimens.
Plots (one orthogonal component) compare top and bottom quartiles, adjusted for sample, age and sex, from a, East Asian, and b, western population samples. Loadings plots from the O-PLS-DA bootstrap analyses are shown with discriminatory metabolites labelled (see Methods for metabolite selection criteria) for c, East Asian and d, western participants. Analyses are after removal of metabolic outliers using the 95% Hotelling’s T2 statistic in the initial PCA. The plots show the number of participants, the number of components used in each model and the Q2Y values (percentage variation in the protein subgroup assignment predictable by the model from cross validation).

