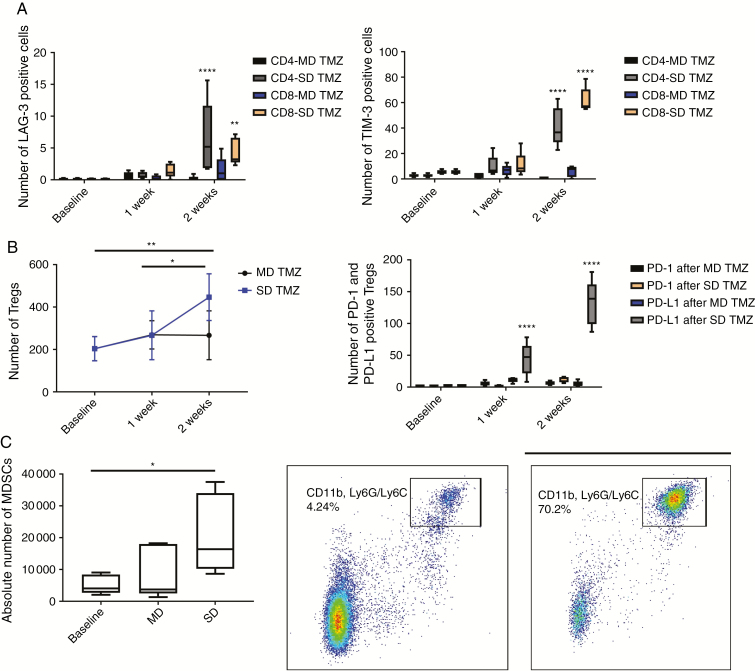
Fig. 2.
Exhaustion markers on peripheral blood T cells and circulatory immunosuppressive cells. LAG-3 and TIM-3 expression on CD4 and CD8 T cells and proportion of Tregs (CD4+ CD25+ FoxP3+) and MDSCs (CD11b+/Ly6G/6c+) were measured in peripheral blood using flow cytometry after TMZ treatment. (A) MD TMZ did not change expression of TIM-3 and LAG-3 on CD4 and CD8 T cells. SD TMZ increased LAG-3+/CD4 (118-fold, P < 0.0001), TIM-3+/CD4 (15-fold, P < 0.0001), LAG-3+/CD8 (104-fold, P = 0.002), and TIM-3+/CD8 T cells (11.6-fold, P < 0.0001). (B) SD TMZ treatment resulted in a relative increase in peripheral blood Tregs (2.3-fold, P = 0.005). MD TMZ did not change the number of Tregs. SD TMZ upregulated PD-L1 expression on Tregs 15.6-fold (P < 0.0001) after 1 week and 47.14-fold (P < 0.0001) after 2 weeks. (C) The mean number of MDSCs increased 4-fold (P = 0.04) 2 weeks after SD TMZ. n = 5 per group; baseline = tumor-bearing animals without any treatment.

