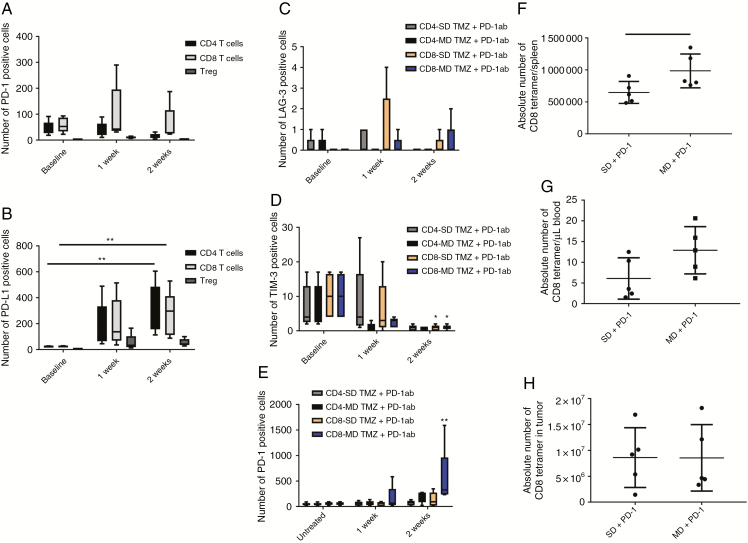
Fig. 4.
Evaluation of exhaustion markers on T cells and expansion of T cells after PD-1 antibody or combination treatment. (A) PD-1 antibody treatment did not change PD-1 expression on CD4 and CD8 T cells or Tregs. (B) PD-L1 expression increased on CD4 T cells (14.51-fold, P = 0.002) and CD8 T cells (11.6-fold, P = 0.009) 2 weeks after PD-1 antibody treatment. (C–E) Markers of exhaustion were tested in animals treated with combination PD-1 inhibition and TMZ. LAG-3 expression did not change on CD4 and CD8 T cells when animals were treated with PD-1 antibody in combination with MD or SD TMZ. TIM-3 expression was decreased on CD8 T cells after combination of SD TMZ (9.4-fold) and MD TMZ (9.2-fold) with PD-1 antibody (P = 0.02). MD/PD-1 antibody treatment demonstrated a 9.33-fold increase in the percentage of PD-1+/CD8 T cells 2 weeks after treatment (P = 0.0006). (F) OT-I T cells were infused into B16F10-OVA tumor-bearing mice after SD and MD TMZ treatment in combination with PD-1 antibody. OT-I+/CD8 T cells were significantly more prevalent in the spleens of animals treated with MD TMZ/PD-1 antibody (1.5-fold, P = 0.04) compared with the SD TMZ/PD-1 antibody group. (G) OT-I+/CD8 T cells had a trend for an increase in the blood of animals treated with MD TMZ/PD-1 antibody (2.12-fold). (H) B16F10-OVA intracranial tumors had no difference in the number of CD8 tetramer+ TILs between treatment groups. n = 5 per group; baseline = tumor-bearing animals without any treatment.

