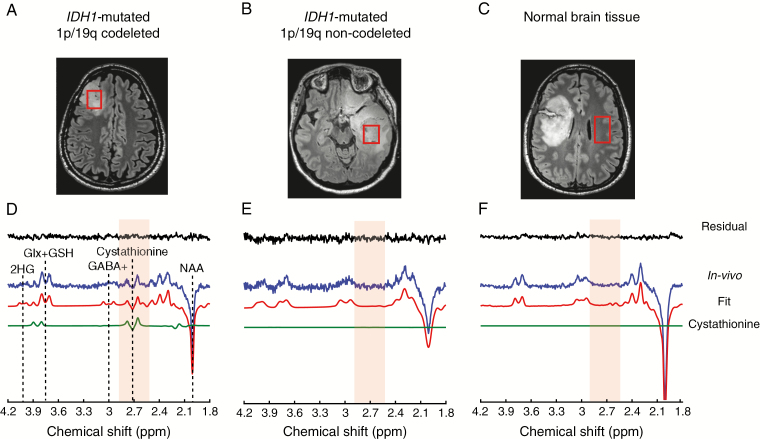
Fig. 1.
In vivo detection of cystathionine. The location and size of the VOIs are shown on FLAIR images in (A) an IDH1-mutated 1p/19q codeleted glioma, (B) an IDH1-mutated non-codeleted glioma, and (C) normal brain tissue. (D, E, F) In vivo spectra (blue) are shown together with LCModel fits (red), the cystathionine contribution (green), and residuals (black). The cystathionine pattern is visible at 2.7 ppm (light orange shading) in the IDH1-mutated 1p/19q codeletion glioma (D), while it is not detectable in the IDH1-mutated non-codeleted glioma (E), and normal tissue (F). Spectra are scaled with respect to the water signal. No line broadening was applied. NAA: N-acetylaspartate; GABA+: GABA + macromolecules; Glx + GSH: glutamate + glutamine + glutathione.

