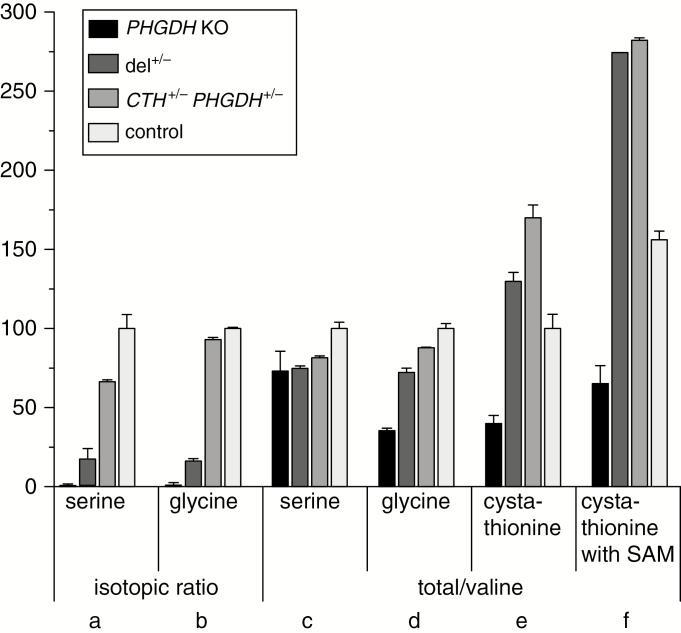
Fig. 4.
Metabolic analysis of human RPE-1 cells. Cells were generated with heterozygous inactivation of CTH and PHGDH or biallelic inactivation of PHGDH and compared with the parental cell line (see legend below). From left to right, isotopic ratios (ie, relative isotopic enrichment after 4-h incubation with 13C-labeled glucose) for (A) serine and (B) glycine, and total levels of (C) serine, (D) glycine and (E) cystathionine normalized to valine in cells cultured in standard medium. (F) Cystathionine levels increased upon addition of 100 μM SAM. Error bars: replicate standard deviation. Results are expressed relative to the mean WT levels in standard culture conditions set to 100%. PHGDH KO: monoallelic inactivation of CTH and biallelic inactivation of PHGDH; del+/−: monoallelic inactivation of PHGDH and CTH by a large deletion on 1p; CTH+/− PHGDH+/−: monoallelic inactivation of CTH and PHGDH by intra-exonic mutations; control: parental cell line.

