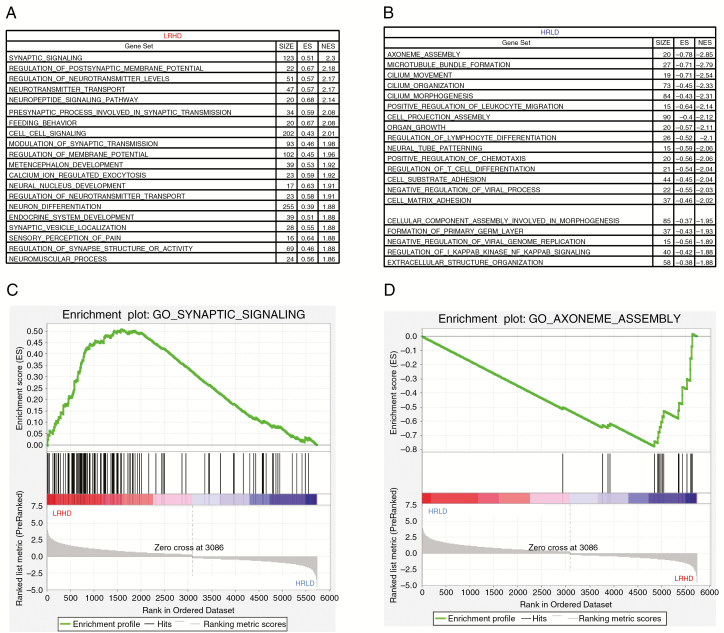
Fig. 5.
HRLD and LRHD subtypes represent distinct functional groups with distinctive patterns of enrichment of specific gene sets and biological pathways in the dataset of TCGA. (A, B) Top 20 gene sets that are enriched in LRHD (A) and HRLD (B) tumors (false discovery rate, 0.01). (C, D) GSEA enrichment plots showing that the gene sets related to synaptic signaling (enriched in LRHD, C) and axoneme assembly (enriched in HRLD, D).

