Fig. 1.
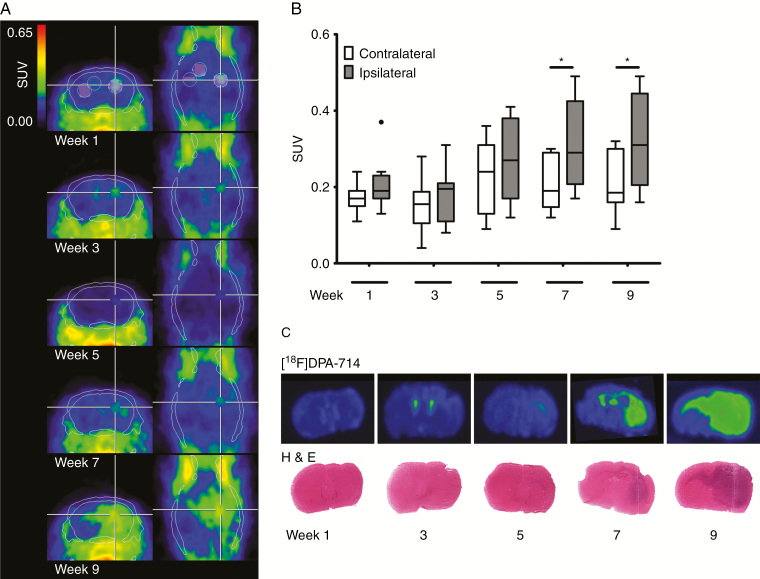
Longitudinal TSPO-PET imaging, quantification, autoradiography, and histology of the human invasively growing P3 glioma model. (A) Summed [18F]DPA-714 PET images (30–60 min post injection) at 1, 3, 5, 7, and 9 weeks p.i. within the same animal indicated glioma growth and infiltration into the contralateral brain hemisphere. White lines represent CT skull contours, white and black circles ipsilateral, contralateral, and corpus callosum VOIs, respectively. (B) Tukey boxplot of ipsilateral and contralateral SUVs at the different imaging points displays significant differences between ipsi- and contralateral VOIs at 7 and 9 weeks p.i., respectively (*P < 0.05; n = 10; • outlier). (C) Autoradiography and H&E staining of corresponding coronal mouse brain sections showing [18F]DPA-714 binding and tumor growth over time.

