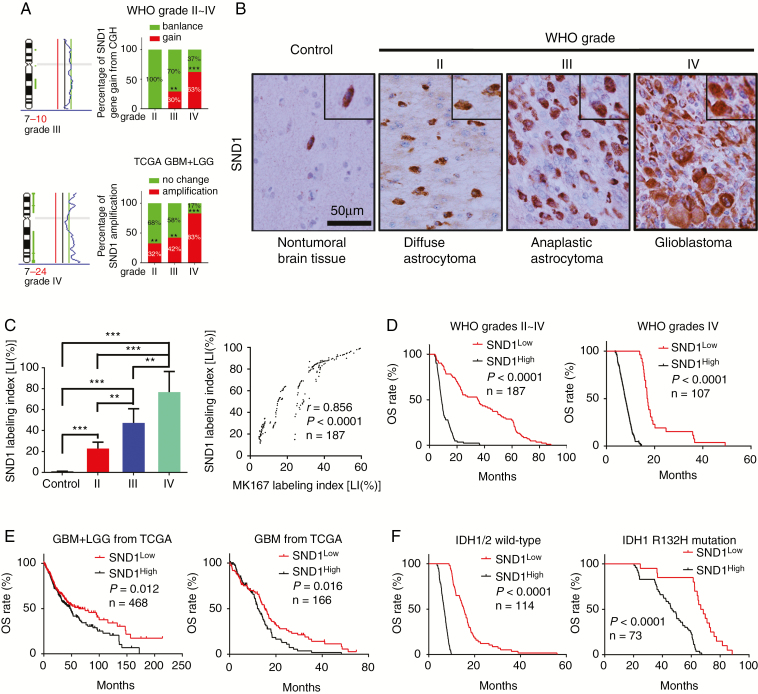
Fig. 1.
SND1 levels correlate with WHO grades and prognosis of glioma. (A) CGH results of WHO grades III–IV gliomas (left and upper right) and SND1 gene amplifications condition from TCGA (lower-right). (B) IHC staining of SND1. Scale bar, 50 μm. (C) Comparison of SND1 protein level (LI [%]) among 187 glioma samples and 20 control brain samples (left), and the linear regression compares the expression of SND1 and MKI67 in 187 gliomas (right). (D) KM analysis of the outcomes of WHO grades II-IV glioma (left) and grade IV GBM (right) patients stratified by SND1 LI (OS). (E) KM analysis of the effect of SND1 mRNA level on GBM+LGG and GBM survival from TCGA (OS; GBM+LGG, n = 468, left; GBM, n = 166, right). (F) Survival analysis of the relation between SND1 protein expression and patients’ outcome for all wild-type IDH1/2 glioma (left, n = 114) and IDH1 R132H mutation-bearing (right, n = 73) glioma patients (OS). Patients were stratified by median SND1 levels. **P < 0.01; ***P < 0.001.

