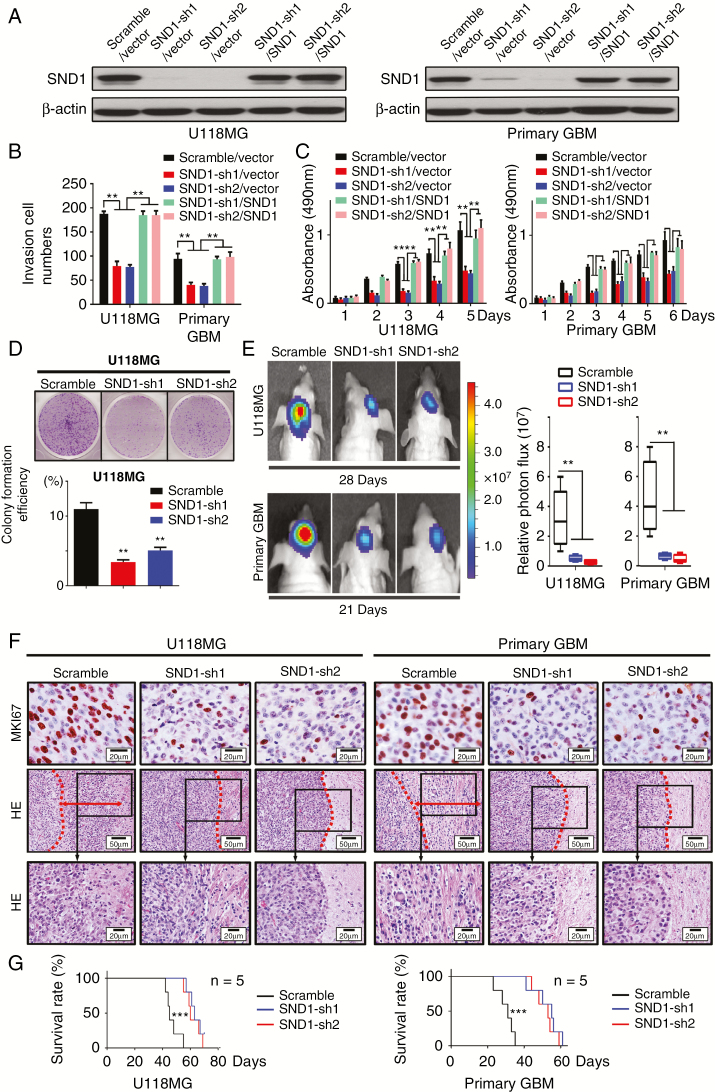
Fig. 2.
SND1 facilitates GBM cell invasion and proliferation. (A) Western blotting results of the SND1 level in U118MG and primary GBM cells of control (scramble/vector), SND1-knockdown (SND1-sh1/vector, SND1-sh2/vector), and SND1 rescue expression (SND1-sh1/SND1, SND1-sh2/SND1) groups. (B) The transwell results of aforementioned U118MG and primary GBM cells. (C) MTT proliferation assays of aforementioned cells. (D) Colony formation of U118MG cells expressing control shRNA (scramble) or SND1-shRNAs (SND1-sh1, sh2). *P < 0.05, **P < 0.01. (E) U118MG and primary GBM cells bearing control shRNA (scramble) or shRNAs against SND1 (SND1-sh1, sh2) were inoculated orthotopically into NOD-SCID mice (n = 5). Tumor volumes were measured by the ISVS system after 28 days (U118MG) or 21 days (primary GBM) of initial implantation. (F) IHC staining for MKI67 (upper panel) in a xenograft tumor from mice transplanted with U118MG and primary GBM cells bearing control shRNA (scramble) or shRNAs against SND1 (SND1-sh1, sh2). Representative images of the invasion condition in HE stained tissue from the scramble, SND1-sh1, and SND1-sh2 (middle and bottom panel) xenografts. The red dashed line marks the tumor border, and the red arrow displays the invasion distance. (G) Survival results analyzed by the KM estimator showed that mice bearing SND1-sh1 and sh2 GBM cells survived longer than the control mice (scramble, P < 0.001).

