Fig. 1.
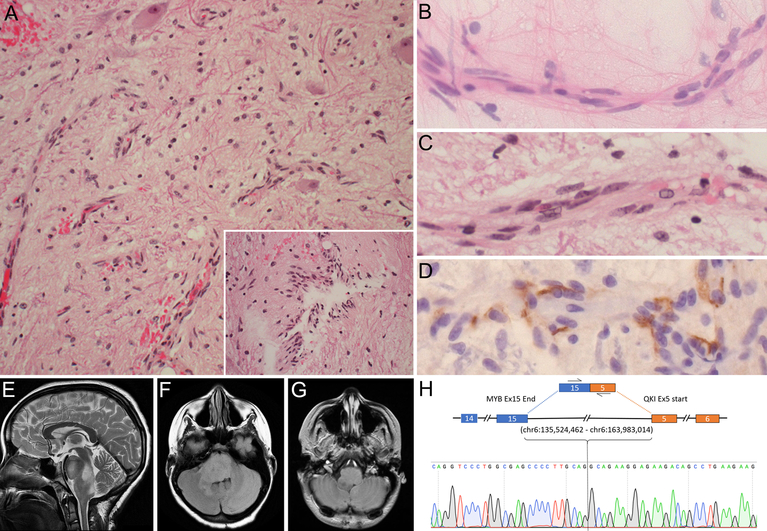
Case 1. Photomicrographs of representative H&E tissue section (A) showing low-cellularity glial tumor with growth along blood vessels or in a perpendicular orientation (inset), with entrapped neurons. Cytologic smear (B) and tissue section (C) highlighting longitudinal growth along blood vessels and elongated nuclei with finely speckled chromatin. D Immunohistochemistry for EMA showing surface and cytoplasmic positivity. MRI images showing a T2-hyperintense (E), FLAIR-hyperintense (F), T1-hypointense non-contrast enhancing (G), dorsally exophytic mass infiltrating pons and medulla. (H) Sanger sequencing of MYB-QKI fusion transcript. Initial magnification in A, 200x; inset, 400x; B-D, 630x

