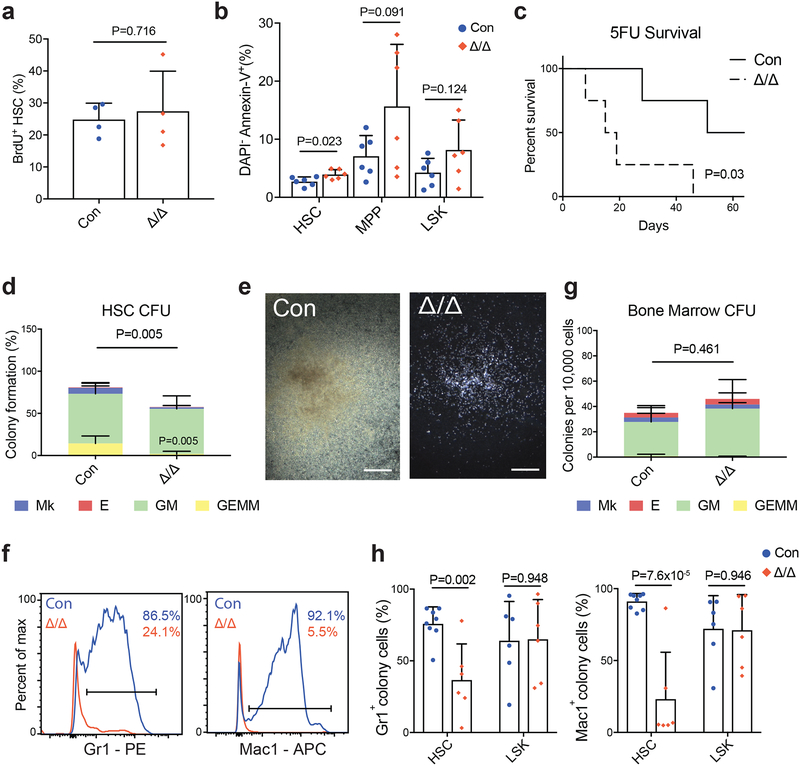
Figure 2. Mettl3 is essential for adult HSC differentiation in vitro.
(a) Frequency of BrdU+ HSCs 10–14 days after pIpC treatment (n=4 for control, n=4 for Mx1-cre; Mettl3fl/fl).
(b) Frequency of DAPI− AnnexinV+ HSC, MPP and LSK populations 10–14 days after pIpC (n=6 for control, n=6 for Mx1-cre; Mettl3fl/fl).
(c) Kaplan-Meyer survival analysis of control and Mx1-cre; Mettl3fl/fl mice treated with weekly 5-FU injections 10 days after the last dose of pIpC. P value by log-rank test (n=4 for control, n=4 for Mx1-cre; Mettl3fl/fl).
(d) Frequencies of colony formation from single sorted HSCs. Colony-forming units (CFU) scored as granulocyte, erythroid, macrophage, megakaryocyte (GEMM), granulocyte, macrophage (GM), megakaryocyte (Mk), or erythrocyte (E) colonies (n=7 for control, n=7 for Mx1-cre; Mettl3fl/fl).
(e) Representative image of CFU-GM from single HSCs from control (left) and Mettl3-deleted (right) single HSCs, genotypes confirmed by PCR. Scale bars are 400um.
(f) Representative flow cytometric histograms of mature myeloid cell surface markers Gr-1 and Mac-1 on HSC-derived colony cells from pIpC-treated control and Mx1-cre; Mettl3fl/fl mice.
(g) Numbers of colonies formed from 10,000 bone marrow cells, scored as CFU-GEMM, CFU-GM, CFU-E, or CFU-MK (n=5 for control, n=5 for Mx1-cre; Mettl3fl/fl).
(h) Quantification of expression of Gr-1 and Mac-1 cell surface markers on HSC and LSK colony cells by flow cytometry (HSC, n=8 for control, n=6 for Mx1-cre; Mettl3fl/fl; LSK, n=6 for control, n=6 for Mx1-cre; Mettl3fl/fl).
All samples are from biologically independent animals. Values are shown as individual points with mean ± s.d. P values were determined by unpaired two-sided Student’s t-test.

