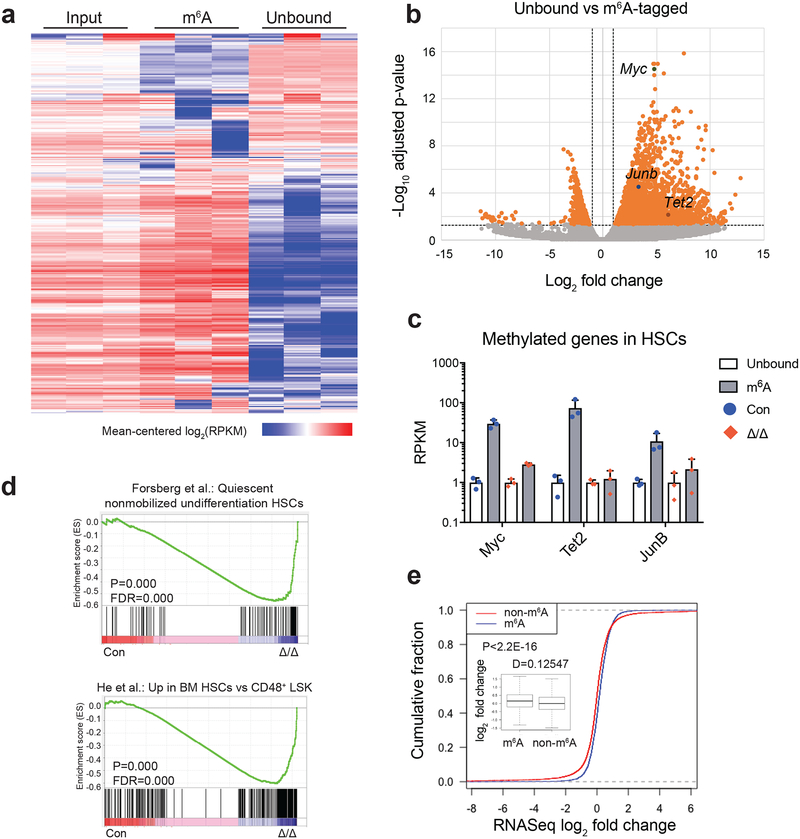
Figure 5. Identification of m6A methylation targets in HSCs.
(a) Heat map of transcript abundance between input, m6A-tagged, and unbound fractions. A total of 5,676 genes with log2(RPKM) ≥5 in ≥4 samples and stdev[log2(RPKM)]≥0.6 are shown.
(b) Volcano plot of meRIP-seq transcript expression differences between m6A-tagged and unbound fractions in HSCs. The x-axis specifies the log2 fold-changes (FC) and the y-axis specifies the log2 false discovery rate (FDR). Dashed vertical and horizontal lines indicate the filtering criteria (log2(FC)>1 and FDR<0.05). Orange dots represent 2,621 transcripts showing statistically significant differences between bound and non-bound factions, of which 2,073 are significantly enriched in the m6A-tagged fraction.
(c) meRIP-seq data showing that transcripts of some known HSC regulators are m6A-tagged in wild-type HSCs, and this methylation is largely eliminated in Mx1-cre; Mettl3fl/fl (Mettl3Δ/Δ) HSCs 10 days after Cre induction. Data were from n=3 biologically independent samples for control and Mettl3Δ/Δ. Values are shown as individual points with mean ± s.d.
(d) Gene set enrichment analysis plots showing that Mettl3-deficient HSCs lose HSC gene signature, as determined by RNA-seq profiling. Analysis completed on gene list ranked by log10 FDR and fold change sign, with enrichment determined after 1,000 permutations. Data were from n=3 biologically independent samples for control and Mettl3Δ/Δ. The statistics was computed using GSEA, and controlled for multiple comparisons by false discovery rate.
(e) Cumulative distribution of log2 (gene expression ratios, Mettl3-deficient/control). Genes were separated as m6A and non-m6A as assessed by meRIP-seq. Insert is the box plot of the log2 fold change in expression of non-m6A and m6A targets in HSCs. Plot displays the mean, standard deviation and interquartile range. P value was determined by two-sided Kolmogorov-Smirnov test.
All sequencing data were from n=3 biologically independent animals for control and Mettl3Δ/Δ.

