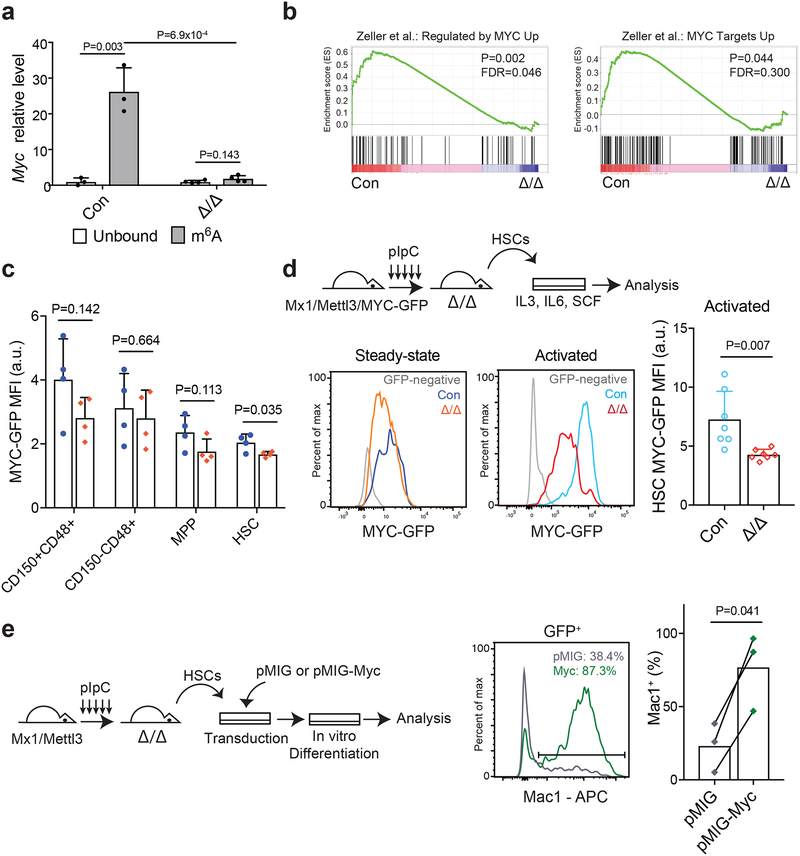
Figure 6. Mettl3 regulates HSC function by targeting Myc.
(a) meRIP-qPCR data showing Myc enrichment in m6A-bound fraction in control and Mx1-cre; Mettl3fl/fl HSCs 10 days after pIpC treatment (n=3 for control, n=4 for Mx1-cre; Mettl3fl/fl). Data shown were normalized to the expression of Rplp0, a target found not to be methylated in HSCs by our meRIP-Seq analysis.
(b) Gene set enrichment analysis plots, as determined by HSC RNA-seq profiling of control and Mx1-cre; Mettl3fl/fl HSCs 10 days after pIpC treatment (n=3 for control and Mettl3Δ/Δ). Mettl3-deficient HSCs significantly lose Myc target genes. Analyses were completed on gene list ranked by log10 FDR and fold-change sign. P values were determined by the GSEA algorithm after 1,000 permutations. The statistics was computed using GSEA, and controlled for multiple comparisons by false discovery rate.
(c) Quantification of the mean fluorescence intensity (MFI) of GFP expression in LSK subsets from Mx1-cre; Mettl3fl/fl; Myc-GFP mice or Myc-GFP controls at least 10 days after pIpC treatment (n=4 for Myc-GFP controls, n=4 for Mx1-cre; Mettl3fl/fl; Myc-GFP). Values were normalized to GFP-negative control cells of the same population.
(d) Schematic of experimental design (top). Representative FACS plots of MYC-GFP expression in HSCs at steady-state (left) and after cytokine activation (right). Quantification of the mean fluorescence intensity (MFI) of GFP expression in HSCs after cytokine activation (n=7 for MYC-GFP controls, n=7 for Mx1-cre; Mettl3fl/fl; MYC-GFP). Values were normalized to GFP-negative control cells.
(e) Schematic of experimental design (left). Representative FACS plot (middle) and quantification (right) of the frequency of Mac-1+ cells in virally transduced colonies from sorted HSCs from Mx1-cre; Mettl3fl/fl mice 10 days after pIpC treatment (n=3 for pMIG, n=3 for pMIG-Myc).
All samples were from biologically independent animals. Values are shown as individual points with mean ± s.d. P values were determined by paired two-sided Student’s t-test.

