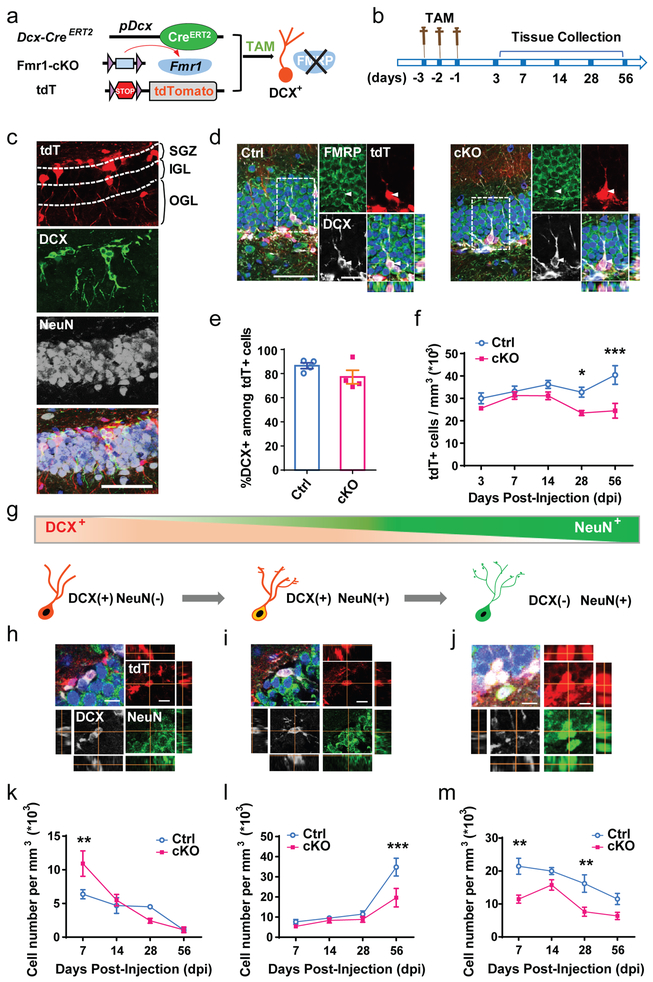
Figure 1: Specific deletion of FMRP from immature neurons leads to reduced neuronal number.
a, Schematic diagram showing generation of inducible conditional FMRP deletion in immature neurons by administration of tamoxifen. b, Experimental scheme for assessing the impact of specific deletion of FMRP from immature neurons on neuronal number in the DG. c, Representative confocal images (from 3 independently repeated experiments with similar results) used for the following analysis including new-born neuronal number and specific stages of development in the DG. The boundaries of SGZ, IGL and OGL were marked by the dashed line. Red, tdT; green, DCX; white, NeuN. Scale bars, 50 μm. d, Representative confocal images (from 3 independently repeated experiments with similar results) of FMRP (green), DCX (white) staining of brain sections from Ctrl;Cre;tdT (left) and cKO;Cre;tdT (right) mice. Scale bars, 20 μm. e, Percentage of DCX+ in total tdT+ cells in DG of cKO;Cre;tdT mice and Ctrl;Cre;tdT mice at Day 7 after tamoxifen injection (Student’s t-test, two-sided, t(6) = 1.529, P = 0.1771. Ctrl: 86.54 ± 2.393, n = 4 mice; cKO: 77.19 ± 5.629, n = 4 mice). f, Quantitative comparison of tdT+ neuronal numbers in the SGZ of cKO;Cre;tdT mice and Ctrl;Cre;tdT mice. (Two-way ANOVA with Bonferroni post hoc test, two-sided: F(4,40) = 2.617, P = 0.0493. Day 3: Ctrl: 30.01 ± 2.446, n = 5; cKO: 25.61 ± 0.7324, n = 6. Day 7: Ctrl: 33.11 ± 2.370, n = 5; cKO: 31.28 ± 1.660, n = 4. Day 14: Ctrl: 36.24 ± 1.753, n = 5; cKO: 31.14 ± 1.727, n = 5. Day 28: Ctrl: 32.76 ± 2.234, n = 6; cKO: 23.47 ± 1.140, n = 5. P = 0.0246. Day 56: Ctrl: 40.42 ± 4.207, n = 5; cKO: 24.48 ± 3.296, n = 4. P = 0.0002). g, Schematic diagram showing the cell markers across stages of maturation that were used: immature DCX-only: DCX+NeuN-; transitioning neurons: DCX+NeuN+; mature neurons: DCX-NeuN+. h-j, Representative confocal images (from 3 independently repeated experiments with similar results) of neurons for analysis of specific stages of development in the SGZ and IGL. h, DCX+NeuN-; i, DCX+NeuN+; j, DCX-NeuN+. Red, tdT; green, NeuN; white, DCX. Scale bars, 20 μm. k-m, Quantitative comparison of specific stages of development: k, DCX+NeuN- (Two-way ANOVA with Bonferroni post hoc test, two-sided, F(3,27) = 4.243, P = 0.014; Day 7: Ctrl: 6.370 ± 0.6726, n = 4; cKO: 10.91 ± 1.899, n = 4. P = 0.0088. Day 14: Ctrl: 4.693 ± 1.169, n = 5; cKO: 5.496 ± 0.8511, n = 5. Day 28: Ctrl: 4.505 ± 0.2918, n = 4; cKO: 2.426 ± 0.3657, n = 4. Day 56: Ctrl: 1.049 ± 0.3171, n = 5; cKO: 1.083 ± 0.4259, n = 4. ; l, DCX+NeuN+ (Two-way ANOVA with Bonferroni post hoc test, two-sided, F(3,27) = 3.475, P = 0.0297; Day 7: Ctrl: 7.636 ± 1.176, n = 4; cKO: 5.403 ± 0.4007, n = 4. Day 14: Ctrl: 9.523 ± 0.6073, n = 5; cKO: 8.345 ± 1.243, n = 5. Day 28: Ctrl: 11.47 ± 1.585, n = 4; cKO: 8.848 ± 1.424, n = 4. Day 56: Ctrl: 1.049 ± 0.3171, n = 5 34.82 ± 4.433, n = 5; cKO: 19.65 ± 4.579, n = 4. P = 0.0009); m, DCX-NeuN+ (F(3,27) = 1.292, P = 0.297; Day 7: Ctrl: 21.45 ± 2.428, n = 4; cKO: 11.46 ± 1.229, n = 4. P = 0.0019. Day 14: Ctrl: 19.99 ± 1.064, n = 5; cKO: 15.77 ± 1.573, n = 5. Day 28: Ctrl: 16.18 ± 2.672, n = 4; cKO: 7.635 ± 1.388, n = 4. P = 0.0087. Day 56: Ctrl: 11.51 ± 1.706, n = 5; cKO: 6.372 ± 1.110, n = 4) of tdT+ neuronal numbers in the SGZ of cKO;Cre;tdT mice and Ctrl;Cre;tdT mice. *P < 0.05, **P < 0.01, ***P < 0.001. All error bars reflect the Mean ± S.E.M.

