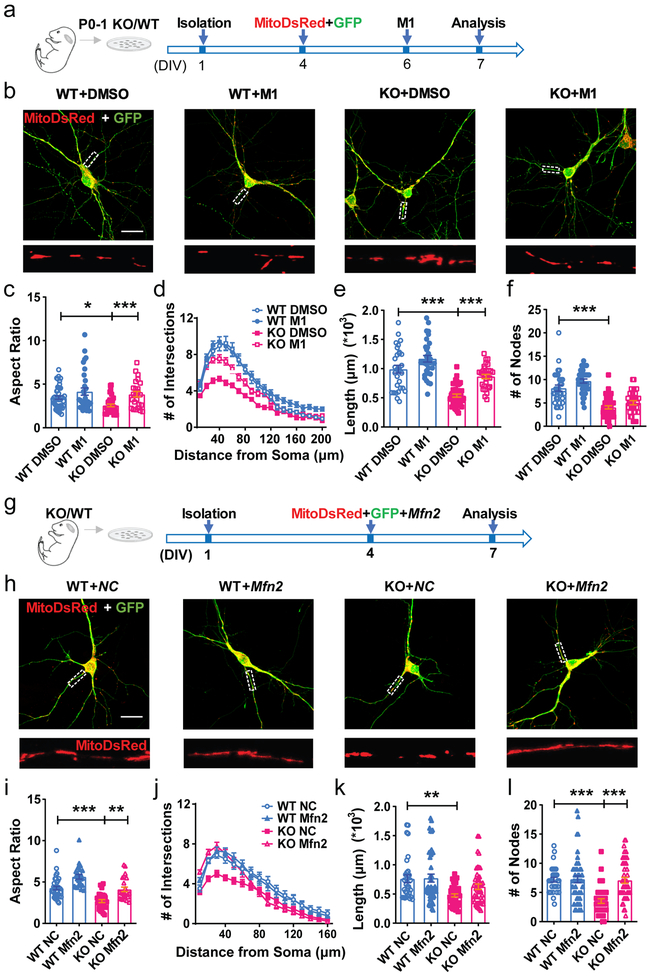
Figure 5: Impaired mitochondrial fusion in FMRP-deficient DCX+ immature neurons.
a, Experimental scheme for assessing the effect of mitochondrial fusion promoting compound M1 on the dendritic maturation of KO neurons. b, Sample confocal images of mitochondria in the Fmr1 KO and WT hippocampal neurons treated with DMSO or M1 (10μM). Enlarged view of the boxed area is shown at the bottom of each image. 3 independently repeated experiments with similar results. Scale bars, 20 μm. c, Quantification of mitochondrial aspect ratio in mitoDsRed expressing Fmr1 KO or WT neurons treated with DMSO or M1 (10μM) (Two-way ANOVA with two-sided Bonferroni post analysis for multiple comparisons: treatment × genotype: F(1, 128) =1.073, P = 0.3022. WT:DMSO vs. KO:DMSO, P = 0.0358; KO:DMSO vs. KO:M1, P = 0.0009. WT:DMSO = 3.449 ± 0.1885, n = 45; KO:DMSO = 2.561 ± 0.1544, n = 36; WT:M1 = 4.143 ± 0.4195, n = 31; KO:M1 = 3.842 ± 0.3202, n = 24 cells from 3 independent experiments). d, Sholl analysis of dendritic complexity of Fmr1 KO or WT neurons treated with DMSO or M1 (10μM) (Multi-ANOVA, WT DMSO vs. KO DMSO: F(1,92) = 42.671, P < 0.0001; WT DMSO vs. WT M1: F(1,81) = 8.045, P = 0.006; KO DMSO vs. KO M1: F(1,92) = 45.808, P < 0.0001. WT:DMSO, n = 30; KO:DMSO, n = 43; WT:M1, n = 32; KO:M1, n = 30 cells from 3 independent experiments). e, Quantification of total dendritic length in mitoDsRed expressing Fmr1 KO or WT neurons treated with DMSO or M1 (10μM) (Two-way ANOVA with two-sided Bonferroni post hoc analysis for multiple comparisons: treatment × genotype: F(1,129) = 66.55, P < 0.0001. WT:DMSO = 0.9901 ± 0.06578, n = 30; KO:DMSO = 0.5379 ± 0.02668, n = 43; WT:M1 = 1.170 ± 0.05598, n = 32; KO:M1 = 0.8647 ± 0.03644, n = 30 cells from 3 independent experiments). f, Dendritic nodes (Two-way ANOVA with two-sided Bonferroni post hoc analysis for multiple comparisons: treatment × genotype: F (1, 131) = 0.3239. WT DMSO vs. KO DMSO: P < 0.0001. WT:DMSO = 8.167 ± 0.6610, n = 30; KO:DMSO = 4.047 ± 0.3344, n = 43; WT:M1 = 9.688 ± 0.4409, n = 32; KO:M1 = 5.033 ± 0.4510, n = 30 cells from 3 independent experiments); g, Experimental scheme for assessing the effect of restoration of MFN1 and MFN2 on the dendritic maturation of KO neurons. h, Sample confocal images of mitochondria in the Fmr1 KO and WT hippocampal neurons transfected with Mfn2 or NC. Enlarged view of the boxed area is shown at the bottom of each image. 3 independently repeated experiments with similar results. Scale bars, 20 μm. i, Quantification of mitochondrial aspect ratio in Fmr1 KO or WT neurons transfected with Mfn2 or NC (Two-way ANOVA with two-sided Bonferroni post hoc analysis for multiple comparisons: treatment × genotype: F (1, 108) = 0.009781. WT:NC vs. KO:NC, P < 0.0001; WT:NC vs. WT:Mfn2, P = 0.0009; KO:NC vs. KO:Mfn2, P = 0.0013. WT:NC = 4.271 ± 0.2085, n = 36; KO:NC = 2.702 ± 0.1834, n = 28; WT:Mfn2 = 5.635 ± 0.2736, n = 24; KO:Mfn2 = 4.112 ± 0.2697, n = 24 cells from 3 independent experiments). j, Sholl analysis of dendritic complexity of Fmr1 KO or WT neurons transfected with Mfn2 or NC (Multi-ANOVA, WT NC vs. KO NC: F(1,61) = 10.436, P = 0.002; KO NC vs. KO Mfn2: F(1,74) = 4.141, P = 0.045. WT:NC, n = 32; KO:NC, n = 30; WT:Mfn2, n = 45; KO:Mfn2, n = 45 cells from 3 independent experiments). k, Quantification of dendritic length in Fmr1 KO or WT neurons transfected with Mfn2 or NC (Two-way ANOVA with two-sided Bonferroni post hoc analysis for multiple comparisons: treatment × genotype: F (1, 158) = 1.560. WT:NC vs. KO:NC, P = 0.0041. WT:NC = 0.7613 ± 0.06684, n = 32; KO:NC = 0.4768 ± 0.02672, n = 40; WT:Mfn2 = 0.7729 ± 0.06793, n = 45; KO:Mfn2 = 0.6257 ± 0.04641, n = 45 cells from 3 independent experiments). l, Dendritic nodes (Two-way ANOVA with two-sided Bonferroni post hoc analysis for multiple comparisons: treatment × genotype: F (1, 158) = 12.02, P = 0.0007. WT NC vs. KO NC: P < 0.0001; KO NC vs. KO Mfn2: P < 0.0001 WT:NC = 7.188 ± 0.3951, n = 32; KO:NC = 3.525 ± 0.3971, n = 40; WT:Mfn2 = 7.267 ± 0.5907, n = 45; KO:Mfn2 = 7.089 ± 0.4993, n = 45 cells from 3 independent experiments). *P < 0.05, **P < 0.01, ***P < 0.001. All error bars reflect the Mean ± S.E.M.

