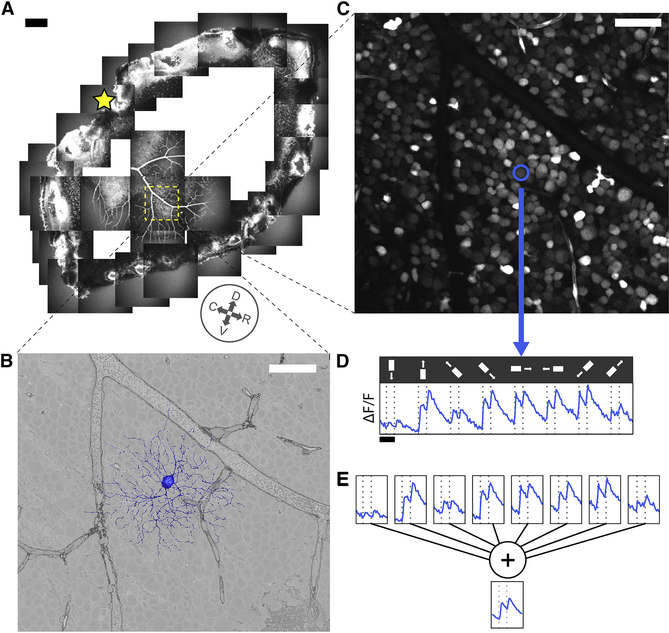
Figure 1: Anatomy and Physiology of Retinal Ganglion Cells via Electron and Light Microscopy.
(A) Hemiretina containing imaged 0.3×0.35 mm2 patch (yellow square). Star, optic disk. Compass rosette, inferred cardinal directions (dorsal, ventral, rostral, caudal, see Methods). (B) 3D reconstruction of GC dendritic arbor (blue) and 2D cross section through GCL in serial EM image (grayscale). (C) Soma of same GC (blue) in image of GCL obtained via two-photon microscopy. (D) Fluorescence versus time for same GC along with stimulus sequence of light bar moving in eight directions on dark background (0.2 mm×1 mm). (E) Averaging over stimulus directions (shown) and trials (not shown) yields temporal response function for GC. Scale bars, 200 μm (A), 50 μm (B, C) and 2 sec (D).

