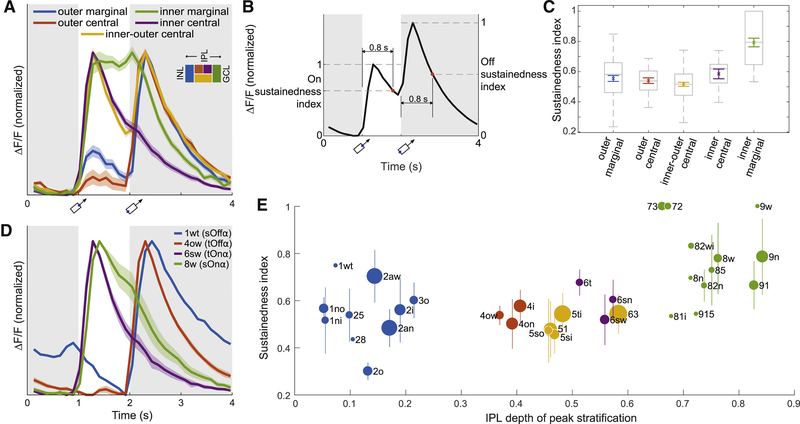
Figure 7: Sustainedness of Visual Responses and Dendritic Stratification.
(A) Average temporal response function (Fig. 1E) for high-level GC clusters (Fig. 3I). Each response function is averaged over cells in a cluster, and normalized to have the same maximum and minimum. The inner marginal cluster is markedly more sustained than the others. Shading indicates standard error (n = 102, 26, 78, 12, 55 for outer marginal, outer central, inner-outer central, inner central, inner marginal). (B) The sustainedness index is defined as the response at 0.8 s after nominal stimulus onset, divided by peak response in the 0.8 s interval. (C) The cells in the inner marginal cluster are significantly more sustained than cells in the other clusters (ANOVA with post hoc p < 0.01). The differences between other clusters are not statistically significant. Colored, mean and standard error; grey box and bars, quartiles, median, and extrema. (D) Marginal is more sustained than central for the four alpha types. Shading indicates standard error of the mean (n = 4, 5, 4 for 4ow, 6sw, 8w). There is no standard error for 1wt, because only a single 1wt cell had calcium signals. Applying t-tests to sustainedness indices yield p = 0.02 for 1wt against 4ow, and p = 0.03 for 8w against 6sw. (E) Sustainedness index for cells with high response quality (Methods, Eq. 4), sorted by clusters. Bars indicate standard deviations for the clusters, except for clusters containing only a single cell with high response quality (1wt, 28, 81i, 8n, 915, 9w). Dot area indicates the number of cells in the cluster; the largest dot (63) represents 18 cells. See Figure S7 for size-adjusted sustainedness index for individual cells.

