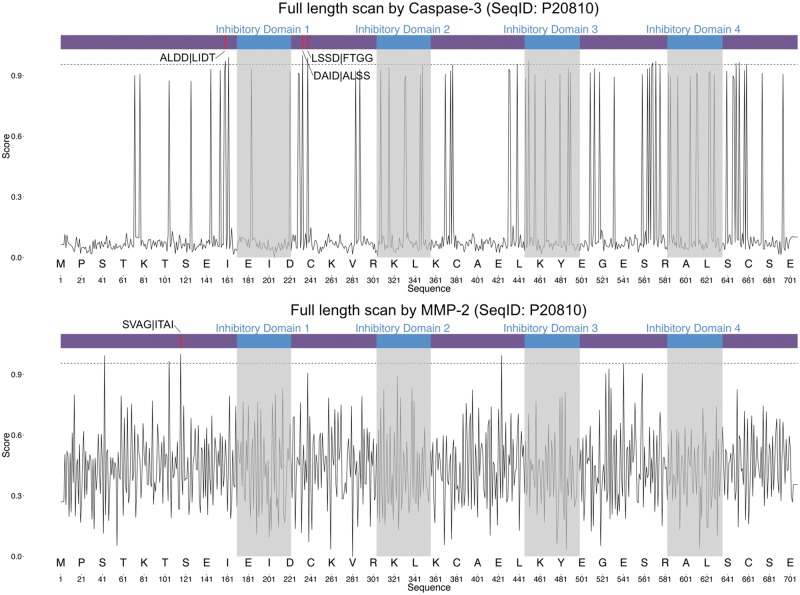
Figure 10.
Full-length sequence scanning of calpastatin by iProt-Sub for caspase-3 (above) and MMP-2 cleavage sites (below). The horizontal axis denotes the amino acid residue position, while the vertical axis denotes the cleavage probability score generated by iProt-Sub. A higher threshold value of 0.95 is applied to identify the high-confidence cleavage site predictions, denoted by the dashed line. P4–P4′ sites surrounding the predicted cleavage P1 position are given.

