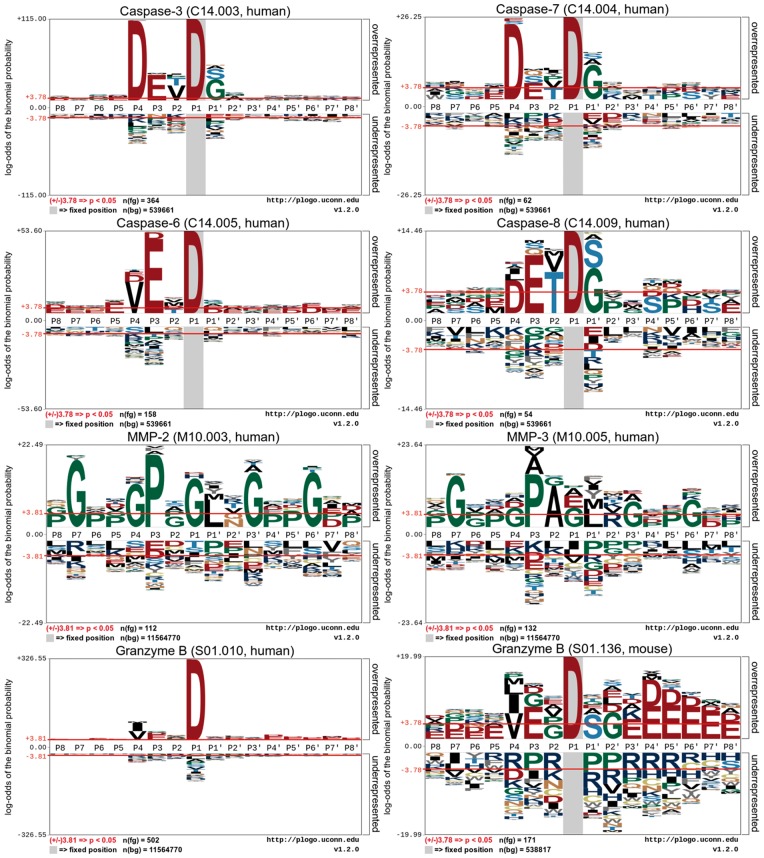
Figure 3.
Sequence logo representations of experimentally verified cleavage sites (P8–P8′) of eight proteases caspase-3, -6, -7, -8, MMP-2, 3, granzyme-B (human) and granzyme-B (mouse). Sequence logos were generated using pLogo and scaled to the height of the largest column within the sequence visualization. The red horizontal lines on the pLogo graph denote the threshold of P = 0.05.

