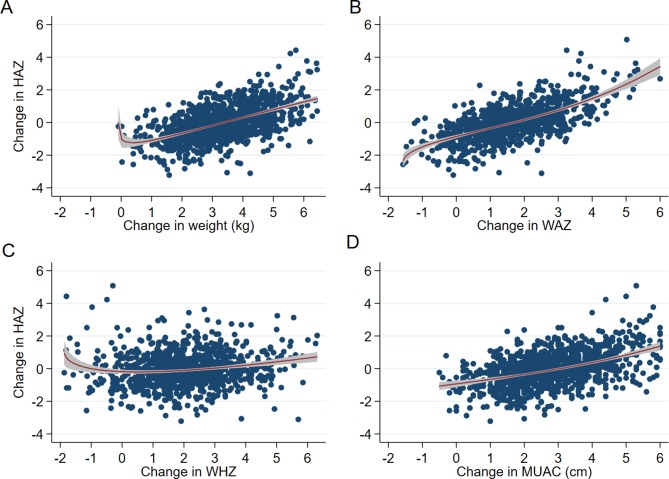
Figure 2.
Scatter plots of change in HAZ with: (A) change in weight (kg) (p=0.25), (B) changes in WAZ (p=0.11), (C) change in WHZ (p=0.07), and (D) change in MUAC (cm) (p=0.24) with fitted fractional polynomial curves (95% CI). P values are from comparisons of model deviance between multiple fractional polynomial regression and linear regression models. HAZ, height/length-for-age z-score; MUAC, mid-upper arm circumference; WAZ, weight-for-age z-score; WHZ, weight-for-height/length z-score.

