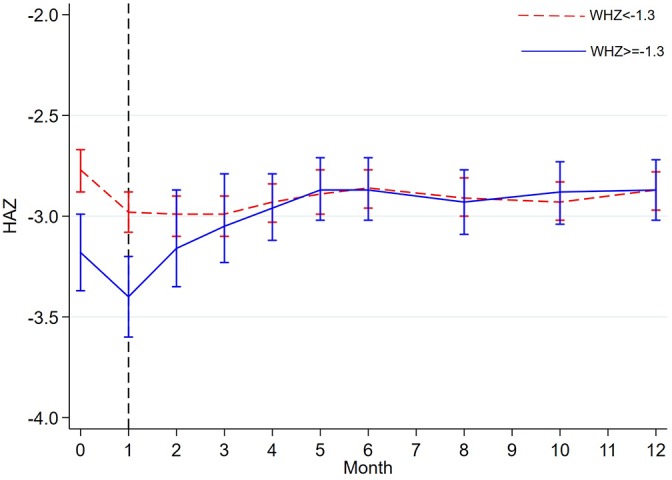
Figure 3.

HAZ trajectory between participants below and above WHZ −1.3 at month 1 of follow-up. The dashed vertical line show time point when the WHZ used to group the participants was taken (month 1); anthropometry was not collected at months 7, 9 and 11; the plotted data are means and 95% CI. HAZ, height/length-for-age z-score; WHZ, weight-for-height/length z-score.
