Figure 3.

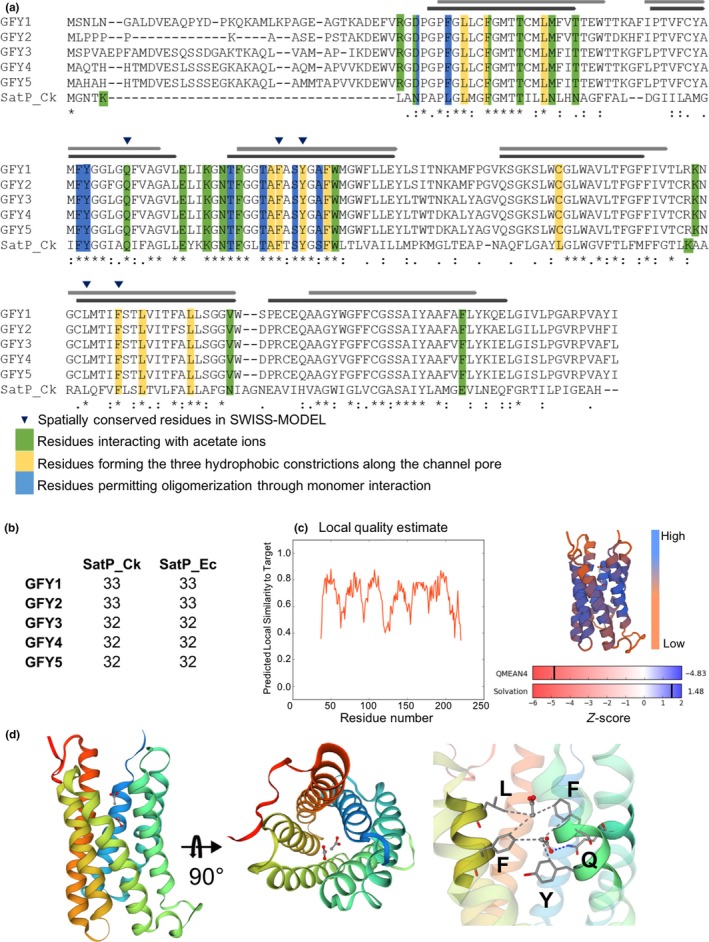
Conserved key amino acid positions of SatP_Ck and CrGFY1–5 isoforms and graphical representation of CrGFY3 protein modeling. (a). Multiple sequence alignment of CrGFY1–5 with SatP_Ck protein sequences. The residues involved in the acetate ion pathway along the pore are highlighted accordingly to their color for specific function as determined in SatP_Ck crystal structure analysis (Qiu et al., 2018). Light and dark gray bars represent the comparison of predicted CrGFY3 transmembrane regions (TM, light gray) with those experimentally determined for SatP_Ck (dark gray). Blue triangles depict residues conserving the relative coordinates of the original template structure and positioned within the expected range for ligand interactions. (b) Percentage identity matrix of CrGFY1–5 protein sequences separately aligned with bacterial proteins SatP_Ck and SatP_Ec. (c) Protein modeling quality estimation. Left: local quality plot showing high score in correspondence of TM core. Top right: ribbon diagram of protein model colored by QMEAN value depicting regions with low or high model quality. Bottom right: Match degree between CrGFY3 and template (SatP_Ck), expressed as Z‐score for QMEAN4 and solvation potential value. (d) Homology modeling of CrGFY3. Left and central panels: ribbon diagram of tertiary structure calculated using SatP_Ck structure as template, front and top view, respectively. The color gradient indicates the amino acid sequence from N‐ (blue) toward C‐terminus (red). Acetate ions and amino acid sidechains are shown in ball‐and‐stick and licorice representation, respectively. Gray and blue dashed lines represent the hydrophobic interactions and hydrogen bond, respectively. Right panel: magnification of the channel pore showing amino acid position from structure overlapping and those residues involved in acetate ion interactions marked with blue triangles in (a)
