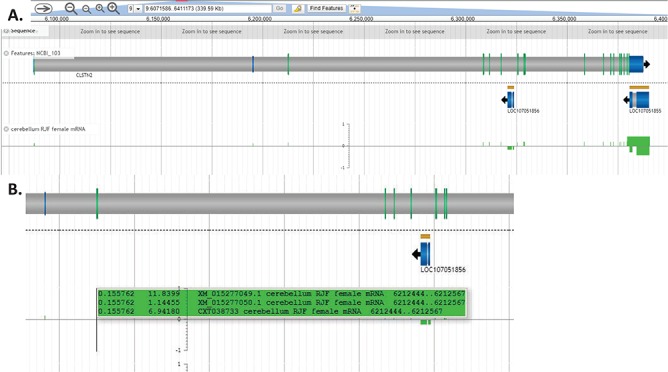
Figure 6.

Expression of individual transcripts in the CoGe browser. (A) Individual experiments are displayed as separate tracks, with genes in the forward orientation represented as positive value and genes in the reverse orientation represented as negative value. (B) Holding the cursor over exons displays individual transcripts and their expression values. The first value is exon expression, and the second value is expression of the full-length transcript (all expression values are calculated as FPKM). This view may be regenerated at https://goo.gl/x5vzaa.
