Figure 4.
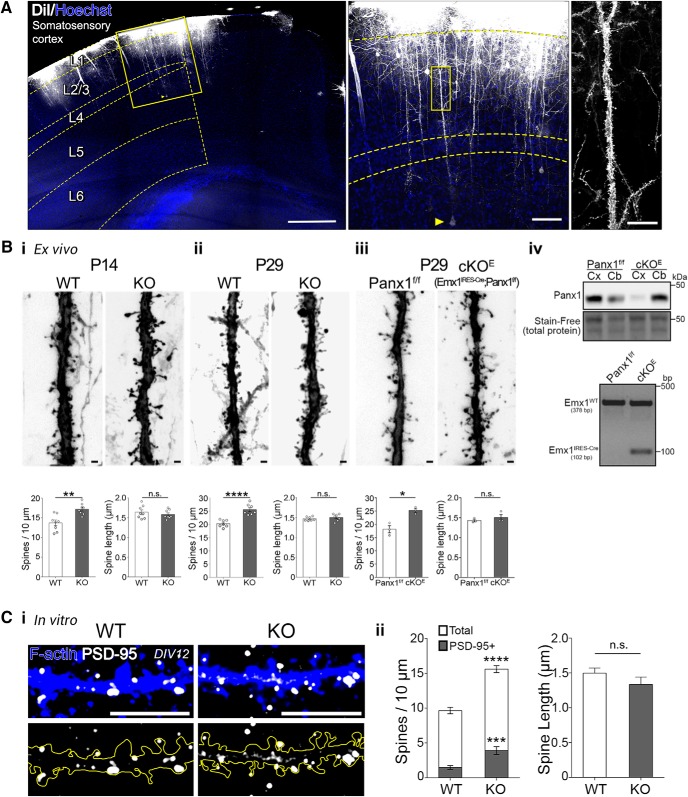
Increased dendritic spine density in Panx1 KO cortical neurons. A, Experimental setup for DiI labeling of apical dendrites of layer 5 somatosensory neurons ex vivo. On the left is a representative micrograph of a WT P14 mouse cortex labeled on the pial surface with DiI with an overlay delimiting the somatosensory cortex and cortical layers. A yellow arrow denotes the cell bodies of the layer 5 cortical neuron, shown in the inset; scale bar, 100 µm. On the right, a 100 µm segment of the primary apical dendrite of the cell in the inset, traversing layer 2/3; scale bar, 20 µm. Scale bar, 500 µm. B, Increased dendritic spine density in Panx1 KO cortical neurons. Bi, Representative maximum intensity projections of Panx1 WT (left) and Panx1 KO (right) neurons at P14. Scale bar, 1 µm. Average spine density was significantly higher in Panx1 KO (WT, 13.7 ± 0.7 spines per 10 µm; KO, 17.2 ± 0.5 spines per 10 µm, p = 0.0014p1; t(14) = 3.9, unpaired t test, n = 8 animals per genotype; **p < 0.01). Average spine length was not significantly different (WT, 1.64 ± 0.06 µm; KO, 1.58 ± 0.04 µm, p = 0.4133p2; t(14) = 0.8, unpaired t test, n = 8 animals per genotype; n.s., not significant). Bii, At P29. average spine density was significantly higher in Panx1 KO (WT, 20.3 ± 0.5 spines per 10 µm; KO, 25.6 ± 0.8 spines per 10 µm; t(12) = 5.8, p < 0.0001q1, unpaired t test, n = 7 animals per genotype; ****p < 0.0001). Average spine length was not significantly different (WT, 1.47 ± 0.01 µm; KO, 1.50 ± 0.03 µm, p = 0.4274q2; t(12) = 0.8, unpaired t test, n = 8 animals per genotype; n.s., not significant). Biii, Similarly, average spine density was significantly higher at P29 in a conditional excitatory neocortical pyramidal cell Panx1 KO (Emx1IRES-Cre/+;Panx1f/f, Panx1 cKOE) compared with Panx1f/f littermate controls (Panx1f/f, 18.2 ± 1.4 spines per 10 µm; cKOE, 25.3 ± 0.8 spines per 10 µm t(4) = 4.6; p = 0.0104r1, unpaired t test, n = 3 mice per genotype; *p < 0.05). Average spine length was not significantly different (Panx1f/f, 1.43 ± 0.03 µm; cKOE, 1.50 ± 0.08 µm, p = 0.4326p2; t(4) = 0.9, unpaired t test, n = 3 animals per genotype; n.s., not significant). Data are represented as mean ± SEM. Biv, Top, representative Western blot of cortical (Cx) and cerebellar (Cb) lysates from control (Panx1f/f) and Panx1 cKOE mice. Bottom, Genotyping results assaying for the presence of Cre and Emx1 in Panx1f/f and Panx1 cKOE. See Methods for more details. Ci, Increased dendritic spine density and PSD-95-positive spine density in cultured cortical neurons at DIV12-14. Representative maximum intensity projections of primary neurite (longest neurite) distal segments from WT and Panx1 KO cultured cortical neurons. Dendritic spines were identified using the phalloidin (F-actin; blue). PSD-95 puncta (white) were quantified (PSD-95+ spines). Scale bar, 10 µm. Cii, Quantification revealed increased mean spine density (WT, 10 ± 0.6 spines per 10 µm; KO, 16 ± 0.5 spines per 10 µm, t(25) = 8.4, p < 0.0001s1; unpaired t test, n = 10–17 cells from 3 independent cultures; ****p < 0.0001), and increased density of PSD-95-positive spines in Panx1 KO cultured cortical neurons (WT, 1.5 ± 0.3 spines per 10 µm; KO, 3.9 ± 0.6 spines per 10 µm, t(25) = 4.2, p = 0.003s2; unpaired t test, n = 10–17 neurons from 3 independent cultures; ***p < 0.001). Spine length was not different between groups (p = 0.2047s3). Data are presented as mean ± SEM.

