Figure 1.

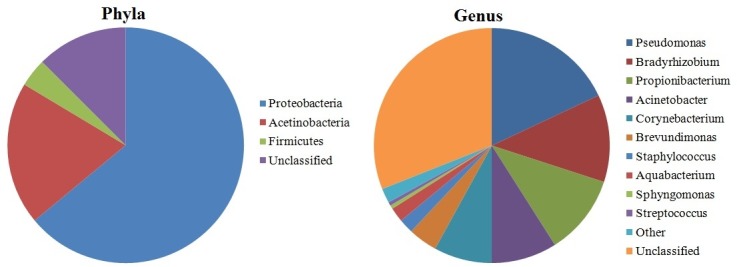
Pie charts displaying the relative proportions of taxa at the phylum level and at the genus level in healthy eye microbiome (according to Dong et al 15 [15]).

Pie charts displaying the relative proportions of taxa at the phylum level and at the genus level in healthy eye microbiome (according to Dong et al 15 [15]).