
Fig. 2 |. Autophagy inhibition promotes crisis bypass.
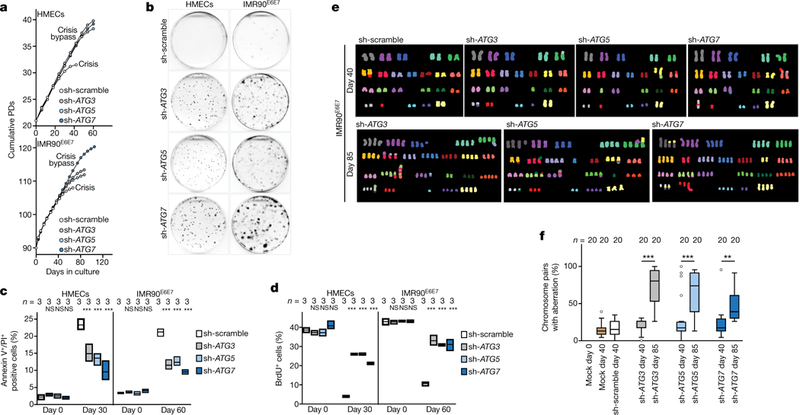
a, Growth curves of post-senescent HMECs and IMR90E6E7 cells that have bypassed senescence expressing non-targeting control short hairpin RNA (shRNA; sh-scramble) or shRNA against ATG3, ATG5 or ATG7. b, Crystal violet viability assay of HMECs and IMR90E6E7 cells expressing non-targeting shRNA or shRNA against ATG3, ATG5 or ATG7. Two independent experiments. Quantification in Extended Data Fig. 4e. c, Cells were stained with annexin V and propidium iodide (PI) and percentages of double-positive cells were measured by flow cytometry. Floating bars show the percentage of Annexin V+/PI+ cells; centre line, mean; box limits, minimum and maximum. n shows number of independent experiments. One-way ANOVA; NS, not significant, ***P < 0.001. d, Floating bars showing the percentage of BrdU+ cells by flow cytometry, as in c. e, Representative multiplex fluorescence in situ hybridization (M-FISH) showing full metaphase spreads of sh-scramble, sh-ATG3, sh-ATG5 and sh-ATG7 IMR90E6E7 cells before crisis (day 40) and sh-ATG3, sh-ATG5 and sh-ATG7 IMR90E6E7 cells that bypassed crisis (day 85). One experiment. f, Box and whisker plots showing percentages of chromosome pairs with aberrations (structural and numerical). Centre line, median; box limits, first and third quartiles; whiskers are plotted according to the Tukey method. n shows number of metaphases analysed. One-way ANOVA; NS, not significant, **P < 0.01, ***P < 0.001. Aberrations listed in Supplementary Table 1. For gel source data see Supplementary Fig. 1.