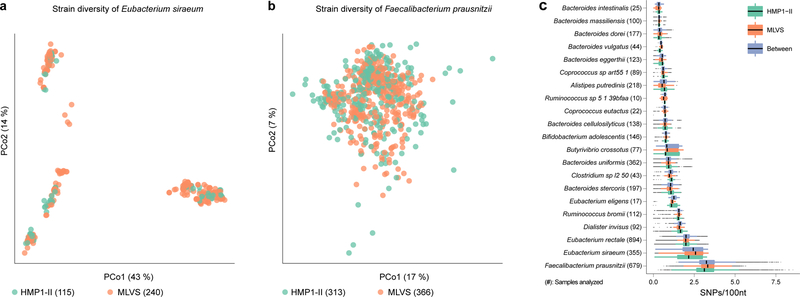
Figure 6. Species-specific patterns of evolutionary divergence within species preserved across cohorts.
Panels show strain-level diversity within A) Eubacterium siraeum and B) Faecalibacterium prausnitzii. Each point represents one sample’s strain, ordinated by principal coordinate analysis of sequence dissimilarity (Kimura Two-Parameter distance). C) Pairwise nucleotide substitution rates within and between cohorts for 21 out of 30 species in Fig. 3 with sufficient prevalence in both cohorts for informative comparison. Lines represent median values, points denote outliers outside 1.5 times the interquartile range. All numbers in parenthesis are sample counts in which indicated strains were above limit of detection; from a total of 913 MLVS stool metagenomes and 553 HMP stool metagenomes (from 253 male and female HMP participants) that were analyzed with StrainPhlAn.

