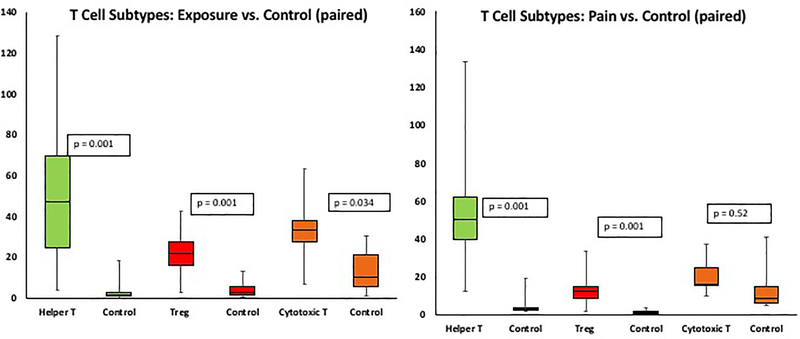
Figure 2.
Box and whisker plots demonstrating T helper (Th), T regulatory (Treg) and cytotoxic T cells (CTL) were greater in exposure group compared to paired control tissue (left), whereas in the pain group only T helper (Th) and T regulatory (Treg) cells were greater compared to paired controls (right).

